Review of eye health among Aboriginal and Torres Strait Islander people
ReviewRazavi H1, Burrow S2, Trzesinski A2 (2018)
Review of eye health among Aboriginal and Torres Strait Islander people
Australian Indigenous HealthBulletin 18(4)
1 Lions Eye Institute
2 Australian Indigenous HealthInfoNet
Suggested citation
Razavi, H Burrow S, Trzesinski A (2018) Review of eye health among Aboriginal and Torres Strait Islander people. Australian Indigenous HealthBulletin 18(4) retrieved from https://healthbulletin.org.au/articles/review-of-eye-health-among-aboriginal-and-torres-strait-islander-people
Contents
Executive summary
Introduction
About this review
Acknowledgements
The context of Aboriginal and Torres Strait Islander eye health
Factors contributing to the eye health of Aboriginal and Torres Strait Islander people
Extent of eye problems among Aboriginal and Torres Strait Islander people
Specific eye conditions
National and multi-state eye programs and services
Policies and strategies for addressing eye health problems
Concluding comments
References
Download PDF version (1.3MB)
Executive summary
Aboriginal and Torres Strait Islander people generally begin life with better vision than the rest of the Australian community. The available evidence indicates that Aboriginal and Torres Strait Islander children have a lower prevalence of vision loss, blindness and refractive error, when compared with non-Indigenous children [1]. This trend reverses by adulthood, with data from the 2016 National Eye Health Survey (NEHS) (Indigenous participants aged 40 years and older and non-Indigenous participants aged 50 years and older) showing a three-fold higher prevalence of vision loss among Indigenous adults compared with non-Indigenous people) [2]. This three-fold disparity among adults was also found in the 2008 National Indigenous Eye Health Survey (NIEHS), indicating that the overall gap in vision has remained unchanged in the eight years between the NIEHS and NEHS [3].
More encouragingly, the prevalence of blindness among Indigenous people does appear to have reduced between 2008 and 2016, from 2.8% to 0.3% [2, 3]. This equates to a gap of 6.2-fold and 1.5-fold, respectively, when compared with non-Indigenous people, suggesting a possible improvement in the prevention or treatment of the most severe forms of vision loss. The number of blind adults found in the 2008 NIEHS and the 2016 NEHS was low, however, which limits the statistical reliability of this data.
In both the 2008 NIEHS and the 2016 NEHS, the three leading causes of vision loss and blindness among Indigenous adults were (1) uncorrected or under-corrected refractive error, (2) cataract and (3) diabetic retinopathy [2, 3].
- Uncorrected or under-corrected refractive error was the leading cause of vision loss among Indigenous adults in the 2008 NIEHS and the 2016 NEHS, accounting for 54% and 61% of vision loss, respectively [2, 3]. The overall prevalence of refractive error among Indigenous adults increased from 5.3% in 2008 to 6.7% in 2016. Unexpectedly, the proportion of Indigenous people who possessed appropriate spectacles increased, from 20% in 2008 to 82% in 2016 [4]. This increased coverage is likely to be attributable, in part, to the expansion of the Visiting Optometry Scheme [5], but remained lower than the 94% spectacle coverage among non-Indigenous adults in 2016 [4]. This gap underlines the call for an integrated, well-coordinated and nationally consistent spectacle subsidy scheme for Aboriginal and Torres Strait Islander people [6, 7], which the Australian Government sought to address in August 2018 by announcing $2 million of dedicated funding.
- Cataract was the second leading cause of vision loss among Indigenous adults in the 2008 NIEHS and the 2016 NEHS, accounting for 27% and 20% of vision loss, respectively [2, 3]. By comparison, cataract accounted for 13% of vision loss among non-Indigenous people in the 2016 NEHS. This gap is explained by discrepancies in the provision of cataract surgery for Indigenous and non-Indigenous adults, including cataract surgery coverage (59% and 88%, respectively [8], cataract surgery rate (7,614 per 1,000,000, and 8,507 per 1,000,000, respectively in 2014-2016) and the median wait time for surgery (152 versus 93 days, respectively) [5]. Whilst the hospitalisation rate for cataract surgery among Indigenous people has risen by 36% in the last years [5], the remaining gap calls for an expansion of existing surgical services, a systems-wide approach for early detection and access to treatment, along with an increased investment in comprehensive care pathways for Indigenous people with cataract [9, 10].
- Diabetic retinopathy (DR) was the third leading cause of vision loss among Indigenous adults in the 2008 NIEHS and 2016 NEHS, accounting for 12% and 5.2% of vision loss, respectively. By comparison, DR only accounted for 1.4% of vision loss among non-Indigenous adults in 2016. Among known diabetics, 1 in 10 Indigenous adults had vision-threatening DR, compared with 1 in 20 among non-Indigenous adults [11]. This gap is multi-factorial, and partly explained by the disparity in appropriate screening for DR between Indigenous and non-Indigenous adults (53% and 78%, respectively, in 2016). Ongoing priorities to prevent and treat the avoidable vision loss from DR include improved primary care [12], health promotion [13], regular annual screening [14] and timely treatment [15]. The ‘Preserve Sight Program’, announced by the Australian Government in July 2018, seeks to address some of these priorities.
A positive trend in the reduction of avoidable vision loss among Aboriginal and Torres Strait Islander is in the area of trachoma. Between 2008 and 2017, the prevalence of active trachoma among 5-9 year old Aboriginal and Torres Strait Islander children in at-risk communities has reduced from 21% to 3.8% [16, 17]. In the 2008 NIEHS, trachoma accounted for 9% of blindness among Indigenous adults, whereas it was not found to be a cause of vision loss or blindness in the 2016 NEHS [2, 3]. However, Australia remains the only developed country with endemic trachoma. Active trachoma among children and trichiasis among adults is still reported in at-risk communities [17], and illustrates the need for ongoing work to eliminate blinding trachoma by 2020 [18].
Introduction
Aboriginal and Torres Strait Islander adults experience a rate of vision loss that is approximately three times higher than that of non-Indigenous people [2]. The 2016 National Eye Health Survey (NEHS) estimated that 18,300, or 11% of Aboriginal and Torres Strait Islander adults suffer from vision impairment or blindness. This burden of eye disease is reported by Aboriginal and Torres Strait Islander people themselves; for example, the 2012–13 Australian Aboriginal and Torres Strait Islander Health Survey (AATSIHS) reported eye problems as the most common self-reported long-term health condition [19]. Overall, 33% of respondents identified eye related and visual problems.
Vision loss has social and economic impacts that include a reduced quality of life, physical mobility, ability to work, reduced life expectancy and increased risk of death for affected individuals [20-22]. These negative consequences are felt not only by affected people, but also by their families and communities [23]. Vision loss can limit opportunities in education, employment and social engagement; it can also increase the risk of injury and be a reason for dependence on services and other people [24, 25]. Mild vision loss has previously been shown to reduce an individual’s ability to live independently and increase the risk of death by 2.6 times, largely due to a higher risk of injury and resultant disability [6, 24]. More recently, visual impairment in both eyes among Indigenous people from remote central Australian communities was found to increase the 10-year mortality risk by 40%, compared with those who were not visually impaired [22].
Normal vision, vision loss and other terms
Normal vision is recorded as 6/6 when an eye chart is used for eye health screening. The numerator is the distance of a person (in metres) from the eye chart; the denominator is the distance (in metres) at which a ‘normal sighted’ person can read a particular line on the chart, e.g. ‘6/12 vision’ means that at 6 metres, a person can read the line on the chart that a normal-sighted person could read at 12 metres, i.e. there is mild visual impairment. The term ‘20/20’ is equivalent to 6/6, but expressed in feet rather than metres.
Vision loss is an impairment of one or both eyes, or of the visual system function, which includes the brain.
Low vision refers to those with vision loss recorded less than 6/12 but better than or equal to 6/60.
Blindness refers to those with vision recorded as less than 6/60 in both eyes.
Driving vision requires a visual acuity of at least 6/12 with one or both eyes for a private license; for a commercial license, the requirements are at least 6/9 in the better eye, and at least 6/18 in the worse eye. In addition to visual acuity, licenses have visual field and other requirements.
In general, the term visual impairment includes blindness; low vision refers to visual impairment excluding blindness [26].
Among Aboriginal and Torres Strait Islander people, the leading causes of vision loss are uncorrected refractive error (the need for appropriate spectacles), cataract and diabetic eye disease. Approximately 80% of vision loss from these conditions is avoidable, through early detection, prevention and treatment [27]. For example, relatively low-cost and effective interventions such as cataract surgery can restore vision almost immediately in many cases.
Despite higher rates of vision loss, research consistently shows that Aboriginal and Torres Strait Islander people use eye health services at lower rates than non-Indigenous people [28]. For example, over one-third of Aboriginal and Torres Strait Islander adults report that they had never had an eye examination. Barriers to accessing eye care include a lack of specialist services in rural and remote areas, the complexity of the patient journey, a lack of coordination within and between services, and uncertainty about service providers and the cost of treatment [9, 29, 30]. For example, the treatment of eye conditions such as diabetic retinopathy (a complication of diabetes) and cataract routinely involve a series of visits to multiple care providers in different locations. Even in areas where eye services were available, Indigenous people did not use them to the same extent as non-Indigenous people [28]. Indigenous people are also more likely to drop out of complex clinical pathways at different points in the system and therefore not receive the comprehensive eye care required for complex eye conditions [31]. Conversely, Aboriginal and Torres Strait Islander patients are more likely to attend ophthalmology appointments if eye clinic staff employ a sensitive, patient-centered approach to providing encouragement, reminders and patient transport [32].
Australian Federal, State and Territory governments have instituted a number of programs to address the barriers to eye care for Aboriginal and Torres Strait Islander people. These include outreach eye care programs, many of which are delivered through Indigenous specific primary health-care services [29, 33]. Academic institutions, such as the Indigenous Eye Health Unit at the University of Melbourne, have also contributed to a national strategy to ‘close the gap’ for vision loss among Aboriginal and Torres Strait Islander people [31]. Other initiatives include spectacle subsidies schemes, surgical support and funding for teleophthalmology and the coordination of eye health services [20, 30, 34].
In 2013, the World Health Assembly endorsed the Universal Eye Health: A Global Action Plan 2014-2019, with the aim of reducing the global prevalence of avoidable blindness by 25% before the year 2020 [35]. In order to meet or supersede its commitment to the Global Action Plan, Australia needs to address the disproportionate rate of vision loss among Aboriginal and Torres Strait Islander people. As well as continuing to improve access to eye care programs, this will require ongoing, accurate population-based survey data, to inform resource allocation for eye health services.
About this review
The purpose of this review is to provide a comprehensive synthesis of key information on eye health among Aboriginal and Torres Strait Islander people in Australia to: (1) inform those involved or interested in Aboriginal and Torres Strait Islander health; and (2) provide the evidence for those involved in policy, strategy and program development and delivery. The review provides detailed discussion on:
- refractive error, cataract, diabetic retinopathy and trachoma among Aboriginal and Torres Strait Islander people, which are the conditions responsible for the majority of vision loss and blindness in this population
- the historical, social and cultural context of eye health, and the factors that contribute to eye problems among Aboriginal and Torres Strait Islander people
- the extent of selected eye problems among Aboriginal and Torres Strait Islander people, including: incidence and prevalence data; hospitalisations; and burden of disease
- the prevention and management of eye problems, including relevant programs, services, policies and strategies that address eye health among Aboriginal and Torres Strait Islander people
- possible future directions for improving the eye health of Aboriginal and Torres Strait Islander people.
This review draws mostly on journal publications, government reports, national data collections and national surveys, the majority of which can be accessed through the HealthInfoNet’s Australian Indigenous Library http://aih-wp.local/key-resources/publications.
When referring to Australia’s Indigenous people, the HealthInfoNet prefers to use the terms Aboriginal, Torres Strait Islander, or Aboriginal and Torres Strait Islander. However, when referencing information from other sources, our authors may use the terms from the original source. As a result, readers will see these terms used interchangeably with the term ‘Indigenous’ in some instances. If they have any concerns they are advised to contact the HealthInfoNet for further information.
Acknowledgements
Special thanks are extended to:
- the anonymous reviewer whose comments greatly assisted finalisation of this review
- staff at the Australian Indigenous HealthInfoNet for their assistance and support
- the Australian Government Department of Health for their ongoing support of the work of the HealthInfoNet.
The context of Aboriginal and Torres Strait Islander eye health
Historical, social and cultural context
The broad health disadvantages experienced by Aboriginal and Torres Strait Islander people can be considered historical in origin [36], but they have been perpetuated by the contemporary social and cultural determinants of health that contribute to current health inequalities [37, 38]. To understand the eye health of Aboriginal and Torres Strait Islander people, it is necessary to understand the historical, social and cultural context of Aboriginal and Torres Strait Islander health.
Aboriginal and Torres Strait Islander people maintained a hunter-gatherer lifestyle up until the late 18th century, but the arrival of Europeans in 1788 led to major changes in lifestyle [39, 40]. Traditional activities associated with finding renewable food and resources, maintaining familial and cultural practices, and sustaining the spiritual connection to country changed over time [36, 39-41]. Adverse changes in physical activity and nutrition have played a part in the development of eye problems and other chronic conditions such as diabetes (an important risk factor for eye disease) among Aboriginal and Torres Strait Islander people [42].
In contemporary society, economic opportunity, physical infrastructure and social conditions influence the health of individuals and communities [37, 43, 44]. These factors are apparent in measures of education, employment, income, housing, access to services, connection with land, racism, and incarceration. On all these measures, Aboriginal and Torres Strait Islander people suffer substantial disadvantage in comparison with non-Indigenous people.
The factors contributing to the eye health of Aboriginal and Torres Strait Islander people are complex, and reflect a combination of broad historical influences, and social and cultural determinants. Limited access to primary and other medical care [45], sub-standard living conditions, inadequate environmental sanitation and poverty all contribute to the development of eye problems in Aboriginal and Torres Strait Islander communities. It is beyond the scope of this review to discuss in detail the underlying social and cultural determinants that influence the development of eye problems, but the main health risk factors are briefly outlined below.
Factors contributing to the eye health of Aboriginal and Torres Strait Islander people
Risk factors
The factors that contribute to eye problems among Aboriginal and Torres Strait Islander people include: age, injury, ultra-violet (UV) exposure, repeated infections (for example trachoma), high blood pressure, obesity [46, 47], low birth weight [48, 49], malnutrition [50-53], engagement in behaviours that can adversely affect health (e.g. poor diet, alcohol and tobacco use) [54-57] and diabetes [57, 58]. Many of these conditions are common among Aboriginal and Torres Strait Islander people and contribute to poor eye health [47, 57, 59]. Given the modifiable nature of many of these factors, efforts to minimise their prevalence can help to reduce eye problems and associated morbidity among Aboriginal and Torres Strait Islander people.
Recently, the 2016 NEHS identified a number of additional risk factors for vision loss among Aboriginal and Torres Strait Islander adults over 50 years of age. Older age was a risk factor for vision loss, with each decade of age being associated with an odds ratio (OR) of 1.6. ‘Living in an outer regional or very remote location’ was a significant risk factor, with an OR of up to 2.02. Women were more at risk of vision loss (1.4 times higher than men), as were Aboriginal and Torres Strait Islander people with self-reported diabetes, those that had never had an eye examination, and those with lower educational attainment.
Protective factors
While a range of behavioural and biomedical factors are known to increase the risk of developing eye problems, improvements in these factors can conversely become protective in nature and contribute to improvements in eye health. For example, a better nutritional intake among a Central Australian cohort of Aboriginal people was found to protect against chronic diseases including hypertension, diabetes and cardiovascular disease [60], all of which have known associations with eye health. A systematic review of Aboriginal populations in Australia, Canada, New Zealand and the USA found that improved maternal health was associated with a reduced burden of cardio-metabolic diseases including diabetes, impaired kidney function and adiposity [61].
While these studies have not specifically looked at protective factors for eye health among Aboriginal and Torres Strait Islander people, the association between modern chronic diseases and eye health is well established [62, 63]. Beneficial changes in lifestyle, such as reductions in tobacco use and hypertension, and improvements in diet, can therefore reduce the risk of eye problems in Aboriginal and Torres Strait Islander people.
Extent of eye problems among Aboriginal and Torres Strait Islander people
Nationally, it has been estimated that low vision and avoidable blindness are responsible for 11% of years of life lost to disability (YLD) for Aboriginal and Torres Strait Islander people [64]. According to measures of the overall burden of disease, vision loss and blindness constitute the fourth largest contributor (after heart disease, diabetes, and road traffic accidents) to the health gap between Aboriginal and Torres Strait Islander and non-Indigenous people. In 2011, the rate of disability-adjusted life years (defined as the number of years lost to ill health, disability or early death) due to vision loss per 1,000 people was 2.2 for Aboriginal and Torres Strait Islander people, compared with 0.7 for non-Indigenous people [65]. In other words, Aboriginal and Torres Strait Islander people had a three times higher chance of life years being affected by vision loss, when compared with non-Indigenous people.
Assessing the overall impact of vision loss
Vision loss and blindness have often not received the priority they warrant, largely because considerable attention in health planning is directed to mortality indicators. This shortcoming is being addressed, to some degree, by attention to disability-adjusted life years (DALYs), a health measure of the years of life lost to ill-health, disability or death. The measure, promoted by the World Health Organization (WHO) as part of its attention to the Global Burden of Disease, has been applied in Australia to both the total and Indigenous populations [66]. Application of the DALY measure has enabled much better insights into the overall impacts of various health conditions than was possible with reliance on direct measures of mortality and morbidity.
There are various ways to measure the extent of eye and sight problems in a population, including prevalence, incidence and health service utilisation. While Aboriginal and Torres Strait Islander people report similar levels of eye and sight problems as non-Indigenous people they experience disproportionately high levels of some eye conditions, including blindness.
Measuring eye and sight problems
Age-standardisation enables comparisons between populations that have different age structures. It is often used when comparing Aboriginal and Torres Strait Islander people and non-Indigenous people because the Aboriginal and Torres Strait Islander population has a younger age structure than the non-Indigenous population.
Burden of disease is a measure of the impact of a disease or injury on a population using disability-adjusted life years (DALYs). It provides a combined estimate of years of life lost due to premature mortality and years of life lost due to disability or ill health (YLD).
Hospitalisation refers to an episode of admitted patient care, which can be either a patient’s total stay in hospital (from admission to discharge, transfer or death), or part of a patient’s stay in hospital that results in a change to the type of care (for example, from acute care to rehabilitation).
Incidence is the number of new cases of eye and sight problems that occur during a given period.
Prevalence is the number or proportion of cases of eye and sight problems in a population at a given time.
Rate ratio (RR) is the rate of Aboriginal and Torres Strait Islander people affected by eyes and sight problems divided by the rate of non-Indigenous people affected by eyes and sight problems.
Ratio (R) is the proportion of Aboriginal and Torres Strait Islander people affected by eyes and sight problems divided by the proportion of non-Indigenous people affected by eyes and sight problems.
Prevalence and incidence
Estimates of the prevalence and incidence of eye and sight problems among Aboriginal and Torres Strait Islander people have been obtained from various surveys. These surveys have used different approaches to assess vision loss and as a result their measures of eye health are not directly comparable.
Surveys of Aboriginal and Torres Strait Islander eye health
Data based on eye examinations were collected in studies that include the 2005-2008 Central Australian Ocular Health Study (CAOHS) [67], the 2008 National Indigenous Eye Health Survey (NIEHS) [3], and the 2016 NEHS [2].
The 2005-2008 CAOHS was conducted in 30 Central Australian communities [67]. It examined the eyes of 1,883 Aboriginal and Torres Strait Islander people (aged 20 years and older) over a three-year period from July 2005 to June 2008.
The 2008 NIEHS examined all Aboriginal and Torres Strait Islander children (5 to 15 years) and adults (40 years and older) living in 30 sites across Australia (2,883 participants in total) [3]. The NIEHS compared rates of vision loss and blindness for Aboriginal and Torres Strait Islander children with those for non-Indigenous children from the Sydney Myopia Study; it compared rates of vision loss and blindness for Aboriginal and Torres Strait Islander adults with their total population peers in the Melbourne Visual Impairment study (Melbourne VIP) and the Blue Mountain Eye Study [3].
The 2016 NEHS was a nationwide population-based survey which examined 3,098 non-Indigenous people and 1,738 Indigenous people from 30 sites across 5 remoteness strata between 2015 and 2016 [35, 68]. In accordance with Global Action Plan guidelines, the NEHS recruited non-Indigenous people aged 50 years and older, and Aboriginal and Torres Strait Islander people aged 40 years and older, since the latter have earlier onset and more rapid progression of eye disease and diabetes [68]. The strengths of this study included the large sample size, stratified sampling method and inclusion of all levels of geographic remoteness.
The 2012–13 AATSIHS [19] collected data on the eye health of Aboriginal and Torres Strait Islander people. Measures of eye health from the AATSIHS are based on self-reported data1 collected from a representative sample of around 9,300 Aboriginal and Torres Strait Islander people.
The 2005–2008 CAOHS reported that vision loss was almost four times more common among Aboriginal and Torres Strait Islander people than among non-Indigenous people (25% and 7% respectively) [67]. Blindness was seven times more common among Aboriginal and Torres Strait Islander people aged 40 years and older than among non-Indigenous people (3.6% and 0.5% respectively).
The 2005–2008 CAOHS also estimated that the incidence of visual impairment and blindness from refractive error, cataract, and diabetic retinopathy was higher among Aboriginal and Torres Strait Islander adults than among non-Indigenous adults [69]. Aboriginal and Torres Strait Islander people aged 40 years and older became bilaterally visually impaired at 8.1% per year, and blind at 0.6% per year.2 These levels were higher than those found in the non-Indigenous population (0.3–0.8% and 0.2–0.9%). Advancing age was the main causal factor, being responsible for incidences of 1.2% to 1.5% for diabetic retinopathy, 6.6% to 7.9% for cataract, and 0.7% to 0.8% for trachoma [70].
Data from eye examinations conducted in the 2008 NIEHS demonstrated that, when compared with non-Indigenous people, Aboriginal and Torres Strait Islander children (5 to 15 years old), particularly those living in remote areas, generally had better vision, but Aboriginal and Torres Strait Islander adults (40 years and older) generally had worse vision [71]. After age-adjustment, low vision and blindness were less common (0.2 times and 0.6 times respectively) among Aboriginal and Torres Strait Islander children than among non-Indigenous children (1.4% of Aboriginal and Torres Strait Islander children had low vision and 0.2% were blind) (Table 1). However, low vision and blindness were more common (2.8 and 6.2 times respectively) among Aboriginal and Torres Strait Islander adults aged 40 years and older than among non-Indigenous people (9.4% of Aboriginal and Torres Strait Islander adults had low vision and 1.9% were blind).
The most recent self-reported data on eye and sight problems among Aboriginal and Torres Strait Islander people were collected in the 2012–13 AATSIHS. Eye and sight problems3 (also referred to as diseases of the eye and adnexa [73]) were the most common long-term health condition [72], reported by one-third (33%) of Aboriginal and Torres Strait Islander people. Eye and sight problems were reported by more Aboriginal and Torres Strait Islander females (38%) than males (29%) [73]. After age-adjustment, Aboriginal and Torres Strait Islander people were slightly less likely to report eye and sight problems than non-Indigenous people (ratios were 0.9 for: males; females; and total persons).
Age-specific analyses of the 2012–13 AATSIHS data revealed that eye and sight problems increased with age for both Aboriginal and Torres Strait Islander people and non-Indigenous people [74]. Proportions ranged from: 9% for Aboriginal and Torres Strait Islander people in the 0-14 years age group to 92% for those aged 55 years and over; and 11% to 95% for non-Indigenous people in the comparable age groups. Eye and sight problems were reported less frequently by Aboriginal and Torres Strait Islander people4 than by non-Indigenous people in all age groups apart from the 35-44 and 45-54 year age groups in which Aboriginal and Torres Strait Islander people were slightly more likely to report eye and sight problems5 than non-Indigenous people. The proportions of Aboriginal and Torres Strait Islander people reporting eye or sight problems were similar in non-remote areas6 and remote areas (both 35%), but lower among those living in very remote areas (25%) [75].
Despite Aboriginal and Torres Strait Islander people typically reporting fewer eye and sight problems than non-Indigenous people, the 2012–13 AATSIHS revealed that blindness—and various other eye and sight problems that will be discussed in the relevant sections below—were reported more frequently by Aboriginal and Torres Strait Islander people than by non-Indigenous people. Blindness showed the greatest disparities in Indigenous:non-Indigenous ratios, with Aboriginal and Torres Strait Islander males and females both more likely to report blindness than non-Indigenous people (ratios were 6.3 for males and 8.8 for females) [73]. Age-specific analyses revealed that blindness was more common among Aboriginal and Torres Strait Islander people than among non-Indigenous people in all age groups for which data were available, and the difference was statistically significant for those aged 15-24, 35-44, 45-54, and 55 years and over [74].
The most recent prevalence data on eye and sight problems among Aboriginal and Torres Islander people were collected in the 2016 NEHS [2, 5]. The crude prevalence of vision loss in the NEHS was weighted to account for the sampling rate in each remoteness stratum, since population numbers varied between strata. The weighted prevalence of vision loss among 208 non-Indigenous participants with a presenting visual acuity of <6/12 in both eyes was 6.5% (95% confidence interval (CI) 5.3-7.9). By comparison, 188 Aboriginal and Torres Strait Islander participants were found to have vision loss, corresponding to a weighted prevalence of 11.2% (95% CI 9.5-13.1). After adjusting for age and gender, there was a statistically significant gap in vision loss between Aboriginal and Torres Strait Islander and non-Indigenous people, with vision loss being 2.8 times more prevalent in Aboriginal and Torres Strait Islander people, compared with non-Indigenous people (17.7%, 95% CI 14.5-21.0 vs. 6.4%, 95% 5.2-7.6, P<0.001). The higher prevalence of vision loss among Aboriginal and Torres Strait Islander people was found in all geographic remoteness strata and all age groups sampled in the NEHS.
The 2016 NEHS also reported a 1.4 times higher rate of vision loss among Aboriginal and Torres Strait Islander women compared with Aboriginal and Torres Strait Islander men, a 1.5 fold relative risk of blindness in both eyes among Aboriginal and Torres Strait Islander compared with non-Indigenous people, and the highest prevalence of vision loss among Aboriginal and Torres Strait Islander people aged 60-69 years and 80-89 years [2]. These latter two groups had a greater than 4 times higher prevalence of vision loss when compared with age-matched non-Indigenous participants. The prevalence and causes of unilateral visual impairment and blindness (defined as presenting visual acuity worse than 6/12 and 6/60 in one eye, respectively) were also reported. The age-adjusted and sex-adjusted prevalence of unilateral vision loss was significantly higher in Aboriginal and Torres Strait Islander compared with non-Indigenous participants for both visual impairment (18.7% vs 14.5%; P=0.02) and blindness (2.9% vs 1.3%; P=0.02) [76].
Table 1. Age-adjusted prevalence of vision loss and blindness, by Indigenous status, age 5-15 years, age 40 years and over, Australia, 2007–2016
| Prevalence (%) | Relative risk | ||
|---|---|---|---|
| Indigenous | Non-Indigenous | ||
| Children (2008 NIEHS, Sydney Myopia study) | |||
| Low Vision | 1.4 | 6.4 | 0.2 |
| Blindness | 0.2 | 0.3 | 0.6 |
| Adults (2008 NIEHS, Melbourne VIP, BMES) | |||
| Vision loss | 14.4 | 5.2 | 2.8 |
| Blindness | 2.8 | 0.5 | 6.2 |
| Adults (2016 NEHS) | |||
| Vision loss | 17.7 | 6.4 | 2.8 |
| Blindness | 0.3 | 0.2 | 1.5 |
Notes:
- Data for Indigenous children from the NIEHS.
- Data for Indigenous and non-Indigenous adults from the NIEHS and NEHS.
- Data for other Australians from the Sydney myopia study for children and the Melbourne Visual Impairment Project and Blue Mountains Eye Study (BMES) for adults.
- Age-adjusted to the Australian population; NEHS prevalence data were weighted and adjusted for age and gender.
Sources: Taylor, 2009 [71], Foreman, 2017 [2]
General practice attendances and hospitalisation
Eye and sight problems vary in their severity and are managed accordingly in either primary or tertiary health care settings. Overall in 2015-16, approximately 84,000 (12%) Aboriginal and Torres Strait Islander people had an eye examination in the preceding 12 months [5]. The age-standardised percentage of Aboriginal and Torres Strait Islander people who had an eye examination was 14.8%, compared with 21.0% among non-Indigenous people (rate ratio: 0.7). This represented a widening of the gap from 5.2% in 2014-15 to 6.2% in 2015-16.
Among Indigenous patients that were managed by GPs, 1.1% of all problems in the period April 2010 to March 2015 were related to eye health [77]. After age-adjustment, eye health problems among Indigenous patients were managed by GPs at a similar rate as that for other patients (rate ratio: 1.0). However they were 3.5 times more likely than other patients to see GPs for the management of cataract.
In 2016–17, there were 4,280 hospital separations for diseases of the eye and adnexa among Indigenous people in Australia, accounting for 1.6% of separations (excluding dialysis) (derived from [78]). A more detailed analysis of hospitalisation data is available for 2014–16 when there were around 7,400 hospitalisations for Aboriginal and Torres Strait Islander people for diseases of the eye, equivalent to a crude rate of 5.1 per 1,000 population, most commonly for disorders of the lens [5]. The age-standardised hospitalisation rate was lower among Aboriginal and Torres Strait Islander people compared with non-Indigenous people (10.7 and 13.5 per 1,000, respectively; rate ratio 0.8). However, Aboriginal and Torres Strait Islander people had more than three times the rate of eye injuries when compared with non-Indigenous people (1.4 and 0.4 per 1,000, respectively). Aboriginal and Torres Strait Islander people were less likely to be hospitalised for these conditions in non-remote areas than non-Indigenous people, but they were more likely to be hospitalised for them in remote and very remote areas.
Specific eye conditions
In addition to blindness, Aboriginal and Torres Strait Islander people are at particular risk of developing a number of other eye conditions. The 2016 NEHS [2], 2012–2013 AATSIHS [19] and the 2008 NIEHS [3] provide information on common eye conditions among Aboriginal and Torres Strait Islander people and a summary is provided here, detailed information for various eye conditions is discussed later in this review.
The 2016 NEHS found that the leading causes of bilateral vision loss in both Aboriginal and Torres Strait Islander and non-Indigenous participants were uncorrected refractive error (60.8% and 61.3%, respectively) and cataract (20.1% and 13.2%, respectively), followed by age-related macular degeneration in non-Indigenous participants (AMD; 10.3%) and diabetic retinopathy in Aboriginal and Torres Strait Islander participants (5.2%) (see Figure 1) [2]. Vision loss was due to combined conditions for 2.9% of Aboriginal and Torres Strait Islander and 0.06% of non-Indigenous participants, respectively, and the cause was not determinable for 8.1% of Aboriginal and Torres Strait Islander and 8.7% of non-Indigenous participants. Five Aboriginal and Torres Strait Islander participants were blind in both eyes, with two cases being due to cataract, and three due to diabetic retinopathy, optic atrophy and combined mechanisms.
Figure 1: Weighted causes of vision loss (bilateral distance visual acuity <6/12) in Indigenous and non-Indigenous adults; proportions (%) of vision loss are attributed to each main cause, 2016
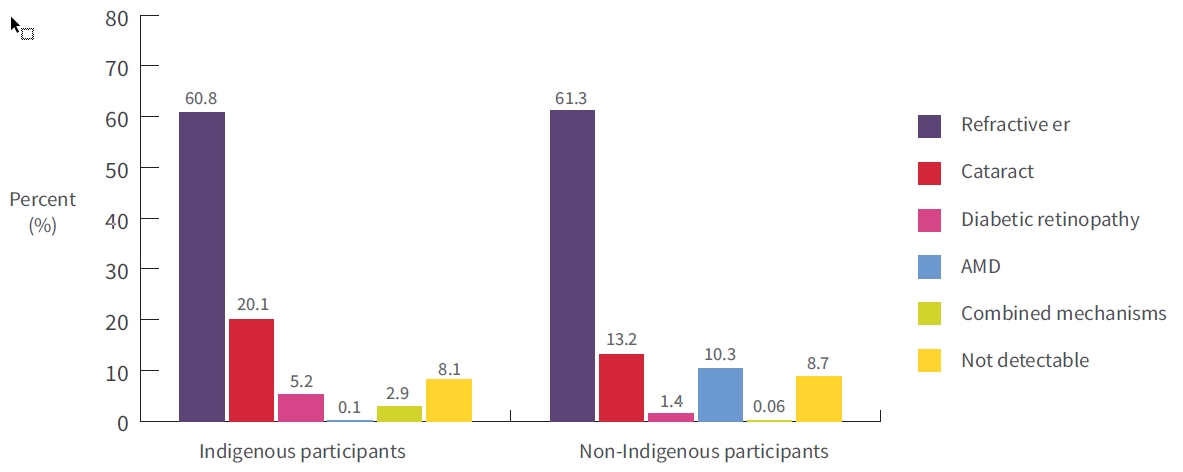
Notes:
- Refractive error is uncorrected/under-corrected refractive error.
- AMD is age-related macular degeneration.
Source: Foreman et al. 2017 [2]
It was notable that diabetic retinopathy contributed to 5.2% of vision loss among Aboriginal and Torres Strait Islander participants in the NEHS, compared with 1.4% among non-Indigenous participants [2]. The authors attributed this difference to the higher prevalence of self-reported diabetes in Aboriginal and Torres Strait Islander participants (37% vs. 14%), as well as the lower use of early detection and treatment services by Aboriginal and Torres Strait Islander people which has previously been reported [2, 28]. The leading causes of unilateral vision loss among both Aboriginal and Torres Strait Islander and non-Indigenous participants were refractive error and cataract (70%-75%), while corneal pathology (17%) and cataract (14%) were the leading causes of blindness in Aboriginal and Torres Strait Islander participants. Most of the cases of unilateral vision loss were deemed to be avoidable by the authors [76].
The most common eye conditions reported by Aboriginal and Torres Strait Islander people in the 2012–2013 AATSIHS were: hyperopia (long sightedness: 19%), myopia (short sightedness: 13%), other diseases of the eye and adnexa7 (5.6%), blindness (3.0%), and cataract (1.1%) (Table 2) [73]. After age-adjustment, Aboriginal and Torres Strait Islander people were more likely to report hyperopia, cataract and blindness than non-Indigenous people (ratios of 1.1, 1.4 and 7.4 respectively), but were less likely to report myopia (ratio 0.8) and other diseases of the eye and adnexa (ratio 0.5).
Table 2. Proportions (%)1 of people reporting specific diseases of the eye and adnexa as long term health conditions2, by sex and Indigenous status, and Indigenous: non-Indigenous ratios, 2012–2013
| Diseases of the eye and adnexa | Males | Females | Persons | ||||||
|---|---|---|---|---|---|---|---|---|---|
| Indigenous (%) | Non-Indigenous3 (%) | Ratio4 | Indigenous (%) | Non-Indigenous3 (%) | Ratio4 | Indigenous (%) | Non-Indigenous3 (%) | Ratio4 | |
| Cataract | 1.2 | 1.4 | 1.7 | 1.0 | 2.0 | 1.2 | 1.1 | 1.7 | 1.4 |
| Myopia | 10 | 21 | 0.8 | 15 | 27 | 0.8 | 13 | 24 | 0.8 |
| Hyperopia | 15 | 25 | 1.1 | 23 | 31 | 1.2 | 19 | 28 | 1.1 |
| Blindness5 | 2.7 | 0.6 | 6.3 | 3.2 | 0.5 | 8.8 | 3.0 | 0.6 | 7.4 |
| Other6 | 5.7 | 16 | 0.5 | 5.5 | 16 | 0.5 | 5.6 | 16 | 0.5 |
Notes:
- Proportions are non-age standardised and are expressed as percentages.
- The condition has lasted, or is expected to last, for 6 months or more.
- Data for non-Indigenous people are for 2011–12.
- Ratios are the age standardised Indigenous proportion divided by the age-standardised non-Indigenous proportion. They are based on proportions that have been age-standardised to the 2001 Australian estimated resident population.
- Includes complete and partial blindness.
- Other diseases of the eye and adnexa include: glaucoma, macular degeneration, astigmatism and presbyopia.
Source: ABS, 2014 (derived from Table 5.3) [73]
The 2012–2013 AATSIHS also provides some age-specific data for selected eye diseases (Table 3) [74]. Age-specific analyses demonstrate that cataract, myopia, hyperopia, blindness and other diseases of the eye and adnexa all tend to increase with age among both Aboriginal and Torres Strait Islander people and non-Indigenous people. The age-specific data for selected eye diseases are discussed in more detail in the relevant sections below.
Table 3. Proportions (%)1 of people reporting specific diseases of the eye and adnexa as long term health conditions2, by age-group and Indigenous status, and Indigenous:non-Indigenous ratios, Australia, 2012–2013
| Diseases of the eye and adnexa | Indigenous people | Non-Indigenous people3 | Total | ||||||||||||
|---|---|---|---|---|---|---|---|---|---|---|---|---|---|---|---|
| Age groups | Age groups | ||||||||||||||
| 0-14 (%) | 15-24 (%) | 25-34 (%) | 35-44 (%) | 45-54 (%) | 55+ (%) | 0-14 (%) | 15-24 (%) | 25-34 (%) | 35-44 (%) | 45-54 (%) | 55+ (%) | Indigenous (%) | Non-Indigenous3 (%) | Ratio4 | |
| Cataract | np5 | np5 | 0.99 | 1.08 | 1.38 | 7.4 | 0.0 | np5 | np5 | 0.28 | 0.58 | 6.3 | 1.1 | 1.7 | 1.4 |
| Myopia | 2.210 | 1110 | 1210 | 1810 | 30 | 36 | 4.210 | 1910 | 2510 | 2610 | 30 | 36 | 13 | 24 | 0.8 |
| Hyperopia | 3.9 | 8.6 | 11 | 2210 | 6010 | 6810 | 4.5 | 9.5 | 8.6 | 1510 | 5310 | 6210 | 19 | 28 | 1.1 |
| Blindness6 | 1.08 | 2.510 | 2.9 | 5.710 | 5.010 | 6.410 | np5 | 0.48,10 | np5 | 0.48,10 | 0.58,10 | 1.410 | 3.0 | 0.6 | 7.4 |
| Other7 | 2.710 | 3.810 | 5.210 | 8.110 | 9.510 | 1410 | 4.910 | 8.810 | 1310 | 1410 | 2110 | 2710 | 5.6 | 16 | 0.5 |
Notes:
- Proportions are non-age standardised and are expressed as percentages.
- The condition has lasted, or is expected to last, for 6 months or more.
- Data for non-Indigenous people are for 2011–12.
- Ratios are the age standardised Indigenous proportion divided by the age-standardised non-Indigenous proportion. They are based on proportions that have been age-standardised to the 2001 Australian estimated resident population.
- Not available for publication but included in totals where applicable, unless otherwise indicated.
- Includes complete and partial blindness.
- Other diseases of the eye and adnexa include: glaucoma, macular degeneration, astigmatism and presbyopia.
- Proportion has a relative standard error between 25% and 50% and should be used with caution.
- Proportion has a relative standard error greater than 50% and is considered too unreliable for general use.
- The difference between the proportion for Aboriginal and Torres Strait Islander people and the comparable proportion for non-Indigenous people is statistically significant.
Source: ABS, 2014 (derived from Table 6.3) [74]
The 2008 NIEHS found that the most common causes of bilateral vision loss and blindness among Aboriginal and Torres Strait Islander people were refractive error, cataract, diabetic retinopathy, optic atrophy, and trachoma (see Figure 2) [23]. The most common causes of low vision among Aboriginal and Torres Strait Islander adults aged 40 years and older were uncorrected refractive error (54%); cataract (27%); and diabetic retinopathy (12%) [23, 71]. The most common causes of blindness were: cataract (32%); refractive error and optic atrophy (both 14%); and diabetic retinopathy and trachoma (both 9%).
Figure 2 Proportions (%) of vision loss and blindness for specific causes, Indigenous adults, Australia, 2008
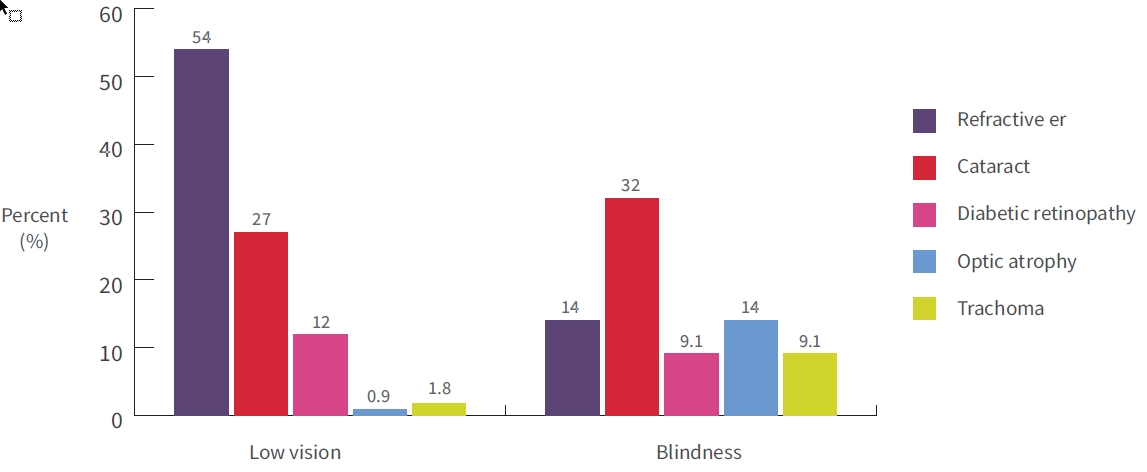
Source: Taylor, 2009 [71]
Refractive error
Refractive error is a common eye disorder, where abnormalities in the length, curvature or lens of the eye lead to defocussing of light and a blurred visual image [26, 79]. It is the most readily preventable cause of vision loss, with most cases being amenable to spectacle or contact lens correction [80, 81]. Uncorrected refractive error (no spectacles) or an under-corrected refractive error (inappropriate spectacles) can result in vision loss and blindness. The blurred vision resulting from uncorrected and under-corrected refractive errors affects everyday visual tasks such as driving, recognising faces, reading, using a mobile phone and preparing food. Uncorrected refractive error is known to reduce quality of life, school performance, employability, productivity, and is a significant cause of disability [82].
The causes of refractive error are multiple and complex, and include inherited genetic factors, the refractive state of the eye at birth, growth of the eye in infancy, time spent in outdoor activities in childhood, access to spectacle correction, and the development of cataract [83, 84]. There are four common types of refractive error: hyperopia, myopia, presbyopia and astigmatism, and more than one type of refractive error may be present in the same eye at once.
Refractive errors are the leading cause of visual impairment and the second leading cause of blindness globally [85]. Consequently, uncorrected refractive errors have been targeted as a priority by the World Health Organization’s Vision 2020 initiative. Likewise, uncorrected refractive errors are a leading cause of visual impairment and blindness among Aboriginal and Torres Strait Islander people in Australia [2, 4], as discussed further in this section.
Types of refractive error
Hyperopia or hypermetropia (long sightedness) occurs when the eyeball is too short and light rays focus behind the retina (the innermost layer of the eye) making near images look blurred.
Myopia (short sightedness) occurs when the eyeball is too long and light rays focus in front of the retina, making distant images look blurred.
Presbyopia is a focusing problem associated with ageing that results in difficulty seeing close objects. The focusing problems occur when the lens of the eye loses its flexibility and becomes less able to change shape.
Astigmatism is a problem that results in uneven focus. It occurs when the shape of the front surface of the eye (the cornea) is not normal, causing blurred images at all distances.
Anisometropia is a condition where the two eyes have unequal refractive power. Each eye can be myopic, hyperopic, astigmatic or a combination of these.
Refractive error among Aboriginal and Torres Strait Islander people
Refractive errors are the most commonly reported eye conditions among Aboriginal and Torres Strait Islander people, and one of the leading causes of their visual disadvantage [30]. Aboriginal and Torres Strait Islander people have previously been reported to have a lower prevalence of refractive error, when compared with non-Indigenous people [86]. However, refractive error blindness has been previously been estimated as five times higher for Aboriginal and Torres Strait Islander adults than for non-Indigenous people, although this estimate was based on small numbers of participants [3, 71]. Meanwhile, Aboriginal and Torres Strait Islander children, particularly those living in non-urban areas, have been found to have good vision [3].
Prevalence
National estimates of the prevalence of refractive error among Aboriginal and Torres Strait Islander people are available from self-reported data and eye examinations. Most previous surveys have focused on the prevalence of vision loss and blindness from uncorrected or under-corrected myopia (refractive error for distance vision) found on screening and examination of participants. Surveys that did not include uncorrected hyperopia (near vision impairment) and astigmatism in their examinations are likely to have underestimated the total prevalence of refractive error per se. To some extent, the latter may be better estimable from self-reported data, which are further discussed below.
The 2016 NEHS reported that uncorrected refractive error is the most common cause of bilateral vision loss for distance vision in Aboriginal and Torres Strait Islander adults, accounting for 61% of cases [2]. The prevalence of uncorrected or under-corrected refractive error for distance vision was 6.7% in Aboriginal and Torres Strait Islander participants, which was significantly higher than the 4.0% found among non-Indigenous participants (p<0.001). For near vision impairment, the weighted prevalence was 34.7% in Aboriginal and Torres Strait Islander participants, compared with 21.6% in non-Indigenous participants [87]. Near vision impairment among Aboriginal and Torres Strait Islander participants was associated with older age (odds ratio (OR) 1.69 per 10 years, P<0.001), fewer years of education (OR=0.9 per year, P=0.003) and residing in inner regional (OR=2.0, P=0.008), outer regional (OR=2.17, P<0.001) and remote geographic areas (OR=1.72, P=0.03).
The 2008 NIEHS reported a similar trend to the 2016 NEHS, in that uncorrected refractive error was the leading cause of bilateral low vision, accounting for 56% of children and 54% of adults with low vision. Among blind adult participants, uncorrected refractive error was the second leading cause (14%; 3 of 22 blind adults) [3, 71]. The overall prevalence of refractive error for distance vision among 1,694 children (5-15 years) and 1,189 adults (40 years and older) examined in the NIEHS was 8.7% and 5.3% respectively. There were no significant differences in prevalence across urban, rural or remote jurisdictions. Blindness due to uncorrected refractive error occurred five times more frequently among Aboriginal and Torres Strait Islander compared with non-Indigenous adults, although the total numbers of participants who were blind in both eyes was low overall (four Indigenous and two non-Indigenous participants).
Subsequent analysis of NIEHS data found that 40% of Aboriginal and Torres Strait Islander adults had near-vision impairment, and were unable to read normal print [88]. This compares with 19% in the Melbourne VIP for a non-Indigenous sample of adults [89]. Research suggests that at least 80% of this near-vision impairment is due to age-related presbyopia, which is easily correctable with reading glasses [90]. Comparisons between Aboriginal and Torres Strait Islander people living in major cities and other areas demonstrated that those in inner regional and remote areas were the least likely to have near-vision impairment (ratios of 0.45 and 0.56 respectively).
The 2005–2008 CAOHS found that refractive error was the main cause of visual impairment among Aboriginal and Torres Strait Islander adults, with changes in the type of refractive error as age increased [69]. Overall, 15.2% of participants were hypermetropic; 11.1% were myopic; and 6.2% had astigmatism, which represented lower rates of refractive error compared with non-Indigenous people. Of the 5 study participants with bilateral blindness, two were due to refractive error, and of those with bilateral visual impairment 69% were due to refractive error. There was a trend towards increasing hypermetropia with increasing age until the age of 70 years (due to progressive presbyopia), after which time they become more myopic (due to progressive cataract formation). There was no association between sex and refractive error [91].
Among Aboriginal and Torres Strait Islander children, a study from Queensland (Qld) found lower rates of refractive error compared with non-Indigenous children [1]. The study screened and examined 595 children, including 181 Aboriginal and Torres Strait Islander children, attending nine primary schools across metropolitan and rural areas in Central and Southern Qld. Refractive error was significantly less common among Aboriginal and Torres Strait Islander primary schoolchildren (10%) than among their non-Indigenous peers (16%), and Aboriginal and Torres Strait Islander children were less likely to have hyperopia and myopia (5.1% and 1.7% respectively) than non-Indigenous children (8.1% and 4.0% respectively), although the differences were not statistically significant. Visual information processing was further assessed using visual motor integration (VMI) and rapid automatised naming (RAN) tests, where VMI is the ability to integrate visual information with find motor hand movements (copying geometric shapes onto a recording sheet), and RAN is a measure of visual-to-verbal transfer (naming visually presented stimuli). Both VMI and RAN scores were found to be slower among Aboriginal and Torres Strait Islander children, with possible implications for limiting their school performance and literacy. However, it is known that both VMI and RAN scores are independently affected by ethnic background, language background and socioenomic status [1]. These potential confounders were not controlled for in this study, which may limit the generalisability of the results.
Prevalence estimates based on self-report include the 2012–2013 AATSIHS. Refractive errors accounted for the majority (83%) of all eye conditions reported by Aboriginal and Torres Strait Islander people. Hyperopia and myopia were the most commonly self-reported eye conditions (19% and 13% respectively), at levels which are substantially higher (19% and 13%, respectively) than those found in the NEHS, NIEHS and CAOHS (Table 3) [73]. After age-adjustment, Aboriginal and Torres Strait Islander people were more likely to report hyperopia than non-Indigenous people (ratio 1.1), but were less likely to report myopia (ratio 0.8). Hyperopia and myopia were the most common eye conditions reported for Aboriginal and Torres Strait Islander children aged 0-14 years (3.9% and 2.2% respectively), although these conditions were reported more frequently among their non-Indigenous peers (4.5% and 4.2%).
Treatment coverage
The available evidence suggests that Aboriginal and Torres Strait Islander people have a consistently lower treatment coverage rate for refractive services than non-Indigenous people [28]. Treatment coverage rate is defined as the proportion of people with refractive error who own distance glasses and have a level of visual acuity which is better than ‘6/12’ (defined in Normal vision, vision loss and other terms). This is the minimum level of vision that meets the eligibility standard for a private driver’s license in Australia; vision less than this is defined as ‘visual impairment’. In most surveys, the treatment coverage for reading glasses (near vision) is reported separately to that for distance glasses. Evidence regarding the unmet need for both distance and near glasses among Aboriginal and Torres Strait Islander people is available from several studies.
The 2016 NEHS found a refractive error treatment coverage rate of 82% for distance glasses in Aboriginal and Torres Strait Islander people, which was significantly lower than the 94% found in non-Indigenous people [4]. Non-Indigenous participants had a significantly higher likelihood of having adequate distance spectacles, compared with Aboriginal and Torres Strait Islander participants, with an odds ratio (OR) of 0.51 (95% CI 0.35-0.75, p=0.001). Treatment coverage rates for non-Indigenous participants did not vary by remoteness, with coverage rates of over 90% in all locations of residence.
For Aboriginal and Torres Strait Islander participants, the treatment coverage rate varied according to socio-demographic factors [4]. Risk factors for low coverage included remoteness of residence, with the lowest rates in outer regional areas (68.4%), and odds ratios (OR) of 0.41 and 0.55 for outer regional and very remote areas (p=0.03 and 0.01, respectively). Other risk factors were never having undergone an eye examination (OR 0.08), and having consulted a health care provider other than an optometrist or ophthalmologist (OR 0.3, 0.11-0.84). Conversely, speaking English was a protective factor for treatment coverage (OR 2.72, 1.13-6.45).
In the 2008 NIEHS, only 20% of Aboriginal and Torres Strait Islander adults wore glasses for distance vision, compared with 56% of all adults [71]. The same survey found that almost two-fifths (39%) of Aboriginal and Torres Strait Islander adults were not able to read normal size print (difficulty with near vision). Reading glasses were worn by 62% of Aboriginal and Torres Strait Islander adults for near work, compared with 86% all adults.
With regard to Aboriginal and Torres Strait Islander children, research into their refractive error and spectacle needs has been limited to date. Compared with non-Indigenous children, Aboriginal and Torres Strait Islander children appear to have better vision overall, and a lower prevalence of vision loss due to refractive error [3]. Among Aboriginal and Torres Strait Islander children in the 2008 NIEHS, only 8% wore glasses [3]. Of the 15 Aboriginal and Torres Strait Islander children with vision impairment due to refractive error, four (27%) were wearing glasses that were not appropriate and reduced their vision to < 6/12. By comparison, the Sydney Myopia Study found that among non-Indigenous children, spectacles were worn by 4% of younger children and 19% of older children [92, 93]. It is not possible to directly compare the spectacle coverage rate between these groups of children, due to the small numbers involved.
Other studies have reported higher levels of uncorrected refractive error among Aboriginal and Torres Strait Islander people in Central Australia and the NT. In Central Australia, 25% of the Aboriginal and Torres Strait Islander adult population needed glasses, but among these, only 9% owned them [91]. In two remote communities in the NT in 2005-06, the unmet need was even greater; while 17% were found to benefit from distance glasses, none of them owned them. Only 9% owned reading glasses, whilst 90% of participants surveyed indicated they would like to own reading glasses [94].
Management of uncorrected refractive error
The treatment of refractive error is easier than the treatment of other causes of vision loss, with a substantial proportion being entirely correctable with appropriate spectacle wear [81]. In urban and regional areas, care for refractive error is most often provided by optometrists and ophthalmologists working in private practices, although optometry services are sometimes also delivered in public hospitals or community health centres [30]. Medicare benefits reduce the cost of consultations, but a gap payment may still be incurred for consultations. Aboriginal and Torres Strait Islander people typically seek care following a referral from a GP or Aboriginal Health Worker working in an Indigenous health service. In remote areas, eye health care is less readily available and is frequently delivered in Indigenous health services by visiting practitioners that are supported by government-funded programs.
Between 2009–10 and 2016–17, the number of episodes of service for Aboriginal and Torres Strait Islander people under the Visiting Optometry Scheme (VOS) rose from approximately 7,000 to 24,500 [5]. On this particular metric, the ‘gap’ has steadily declined since 2009–10, and in fact the number of episodes of service under the VOS for Aboriginal and Torres Strait Islander people exceeded that of non-Indigenous people for the first time in 2016–17. During this time, the number of spectacles dispensed to Aboriginal and Torres Strait Islander people by state schemes was approximately 2,000 in Victoria (Vic), 6,000 in Qld and 5,500 in New South Wales (NSW) [5]. By comparison, the projected number of Aboriginal and Torres Strait Islander people who needed spectacles was approximately 4,000 (Vic), 15,000 (Qld) and 17,000 (NSW), indicating an ongoing shortfall between delivery and need.
In 2011, the annual cost of treating refractive error among Aboriginal and Torres Strait Islander people was estimated at approximately $9 million [20]. The additional expenditure required to ‘close the gap’ in refractive error between Aboriginal and Torres Strait Islander and non-Indigenous people was estimated at $3.5 million. Most of this additional proposed expenditure ($2.4 million) was allocated to coordination activities. Coordination included case-management activities to support and enable Aboriginal and Torres Strait Islander patients to navigate and access treatment for refractive error.
Access to services
The 2016 NEHS authors attributed the higher rate of avoidable vision loss from uncorrected refractive error among Aboriginal and Torres Strait Islander participants to a multitude of factors, including prohibitive distances to spectacle dispensing services, cost uncertainty, a lack of outreach services and an insufficient frequency of eye examinations [2].
A study published in 2013 explored the barriers and solutions for the delivery of refractive services among Aboriginal and Torres Strait Islander people [30]. The study collected data from health care providers, policy makers and community members in NSW, NT, Qld, SA, Vic and WA, and identified a range of barriers that limited Aboriginal and Torres Strait Islander peoples’ access to specialist eye care services, including:
- a poor understanding of eye care and referral processes among primary care practitioners
- irregular use of eye charts and vision testing (particularly near vision testing for reading) by primary health practitioners resulting in inadequate referral to specialist eye care services
- uncertainty about the costs of services and glasses, and confusion about the different providers for eye care services.
Cost uncertainty and lack of confidence in the value of the service were identified as barriers in urban areas, as was inadequate access to culturally safe specialist services. Conversely, higher spectacle coverage rates have been found to strongly correlate with better availability of Aboriginal Medical Service (AMS) based optometry practices in communities [28].
In rural and remote communities, there was proportionately greater access to culturally safe community-controlled health services, but these were not available in all areas and there was often a need to travel long distances to access care.
Spectacle subsidy schemes
Efforts to address refractive error among disadvantaged groups, including Aboriginal and Torres Strait Islander people, have led to the development of various jurisdictional schemes across Australia [95]. These include the Visiting Optometrist Scheme (VOS), Rural Health Outreach Fund (RHOF) and Medical Outreach for Indigenous Chronic Disease Program (MOICDP) [30], which provide funding for outreach services. Schemes are available in some jurisdictions for subsidised or free spectacles for low-income earners, with varying eligibility criteria, payment and product choices in different states and territories. Knowledge of and access to these schemes is reported as being problematic for Aboriginal and Torres Strait Islander patients.
Study findings suggest that in some states the schemes are not well advertised or understood and that communities and service providers may not be aware of their availability [30, 33]. In a 2012 survey of Australian optometrists, the majority of participants confirmed their support for a nationally consistent scheme to provide high quality glasses to Aboriginal and Torres Strait Islander people at low cost or a set price [30, 96]. Criteria for a nationally consistent subsidised spectacle scheme have been endorsed by eye care and Aboriginal peak bodies, and advocacy is ongoing for appropriate low-cost spectacle schemes in each jurisdiction [97].
Future directions
A comparison of the data in the NEHS and NIEHS provides evidence for a possible decline in the prevalence of uncorrected refractive error for both distance and near vision, pointing to improvements in treatment coverage [2, 4, 87]. However, significant disparities remain in the rate of spectacle coverage between Aboriginal and Torres Strait Islander and non-Indigenous people, and continued efforts are needed to provide equitable access to appropriate spectacles for Aboriginal and Torres Strait people. Various strategies have been proposed to address uncorrected refractive error among Aboriginal and Torres Strait Islander people, and improve their access to good quality eye care [30]. A well-coordinated and integrated approach, with improvements in the availability and utilisation of services has been outlined in the Roadmap to Close the Gap for Vision, which includes 42 linked recommendations to address the Aboriginal and Torres Strait Islander eye care needs [6].
Recommendations from this document and other sources [1, 4, 28, 30, 97, 98] include:
- Screening and referral:
- sustainable initiatives that provide improved eye-specific training and support for the primary health care workforce
- improved primary care identification of refractive error (including assessment of both distance and near vision) within communities
- improved primary care referral pathways for people with refractive error to accessible optometry services
- an emphasis on identifying children with early signs of impaired visual function.
- Access to optometry services:
- increased funding for the Visiting Optometry Scheme, based on the local population’s need
- integrated refractive services, whereby the visiting or resident optometrist is hosted within the local Indigenous health service
- increased availability and frequency of resident or visiting optometry services in Indigenous health services (including those in urban areas).
- Provision of subsidised high-quality spectacles:
- supply of high-quality, low-cost, cost-certain glasses to Aboriginal and Torres Strait Islander people, to eliminate uncertainty about availability and affordability
- consideration of an easily accessible national or nationally consistent Aboriginal and Torres Strait Islander subsidised spectacle scheme
- consideration for the provision of safe, effective and economical ready-to-wear reading glasses.
- Governance, coordination and monitoring:
- Shared governance of spectacle schemes by State government, non-government organisations and Aboriginal communities
- broadened eligibility and community participation in service design and implementation
- significant additional investment in coordination personnel to support patients and the system elements
- improved promotion and monitoring of service outcomes within the broader eye care system.
In 2014, improving the treatment of refractive error was prioritised by the Australian Government’s Implementation plan under the National framework for action to promote eye health and prevent avoidable blindness and vision loss. The plan involves a coordinated approach to ensure equitable access to eye health care services [99]. The efficacy of these programs in improving the treatment of refractive error is not currently known, and requires further population-based research.
In 2015, the Victorian Aboriginal Spectacle Subsidy Scheme (VASSS) published their 5-year program delivery findings [98]. Established in 2010, the VASS aims to improve access to affordable spectacles for Aboriginal and Torres Strait Islander Victorians, as an additional subsidy to the Victorian Eyecare Service, and based on principles which include: certain patient co-payments of $10; expanded spectacle frame range; community participation in service governance and implementation. Between 2009 and 2014, patient services provided by the VASS increased from 400 to 1,800 per year, with an average of 1,400 pairs of glasses provided between 2010 and 2014, and a projected delivery of 1,650 spectacles for 2016/17.
The 2016 NEHS identified a greater risk of uncorrected refractive error among (a) Aboriginal and Torres Strait Islander participants who received their last eye examination by a general health care provider other than an optometrist or an ophthalmologist, and (b) participants who had never had an eye examination [4]. This underscores the value of optometrists and ophthalmologists, and the recommendation for regular eye examinations (at least one every five years) among all Australians, particularly those without previously diagnosed eye disease.
In August 2018, the Australian Government announced a one-off contribution of $2 million to increase access to subsidised spectacles for Aboriginal and Torres Strait Islander people [7]. The investment is allocated to Vision 2020 Australia, with the aim of encouraging States and Territories to work together on a nationally consistent approach to spectacle subsidies. Implementation and outcomes of this announcement have not commenced at the time of writing.
Cataract
A cataract is any opacity or ‘clouding’ of the natural lens of the eye. In young people, the natural lens is clear, but it gradually becomes cloudy from 50-60 years of age in most people. This cloudiness diminishes the amount of light that can reach the back of the eye, leading to gradual blurring of vision in both eyes. Normal ageing is the main cause for the development of cataract, but there are many other contributing factors. Cataract may initially reduce vision only slightly, but over time can lead to visual loss and indeed are the leading cause of blindness worldwide [100]. Most of this blindness is avoidable, since cataract can be successfully treated with surgery performed by an ophthalmologist.
Risk factors and the common age of onset for the development of cataract
| Risk factors | Description | Age |
|---|---|---|
| Age | ‘Age-related cataract’; the most common cause of cataract formation. | 60 years onwards
|
| Congenital | Due to a genetic defect (e.g. Down syndrome) or a gestational or childhood illness (e.g. measles). | 60 years onwards
|
| Traumatic
|
Due to a forceful injury to the eye, such as an accident or assault with a blunt or sharp implement. | Any age
|
| Uveitis
|
Due to the presence of inflammation within the eye from another eye-related or whole-body disease process e.g. lupus, ulcerative colitis. | Any age |
| Diabetes
|
Sustained high blood sugar levels accelerate the changes in the structure of lens proteins that contribute to cataract formation. | 40 years onwards
|
| Iatrogenic
|
Side effects from certain medications (e.g. steroid tablets), or previous eye operations (e.g. retinal surgery). | Any age
|
| Environmental
|
Excessive exposure to ambient sunlight (UVB) or occupational ultraviolet light. | 40 years onwards |
| Lifestyle/ nutritional
|
Excessive alcohol consumption, tobacco smoking and poor nutrition are all associated with increased cataract formation. | 40 years onwards |
| Demographics
|
Higher rates of cataract occur in rural and Indigenous populations, as well as those from a lower socioeconomic background. | 40 years onwards |
Sources: Klein B, Klein R, Lee, 1998, Sheeladevi, Lawrenson, Fielder, Suttle, 2016 [101, 102]
There are three main sub-types of cataract, each occurring in different areas of the lens, which each have their own pathology, and sometimes require different surgical techniques for removal:
- ‘nuclear’ cataract occurs in the nucleus or centre of the lens
- ‘cortical’ cataract radiates from the outside of the lens to the centre, like bicycle spokes
- ‘posterial subcapsular’ cataract (PSC) starts from the back of the lens, and can be rapid onset and particularly debilitating.
These three conditions frequently occur together [103].
Cataract among Aboriginal and Torres Strait Islander people
Prevalence
Cataract has been shown to occur more commonly, and develop at an earlier age, in Aboriginal and Torres Strait Islander people compared with non-Indigenous people [19, 21], and is among the most common eye conditions reported by Aboriginal and Torres Strait Islander peoples [24, 26]. The 2016 NEHS found that, among people aged 40 years and over, the prevalence of visually significant cataract was 4.0%, accounting for 20.1% of vision loss among 1,738 Aboriginal and Torres Strait Islander people, compared with 13.2% among 3,098 non-Indigenous people [2]. Among five Indigenous participants who were blind in both eyes, two cases were due to cataract. By comparison, among seven non-Indigenous participants who were blind in both eyes, no cases were due to cataract (five were due to AMD). Cataract was also among the leading causes of unilateral visual impairment and blindness (affecting only one eye) among Aboriginal and Torres Strait Islander participants in the NEHS [76].
Cataract was the fifth most common eye condition reported by Aboriginal and Torres Strait Islander people (1.1%) in the 2012–2013 AATSIHS (Table 2) [71]. Aboriginal and Torres Strait Islander males were slightly more likely to report cataract than Aboriginal and Torres Strait Islander females (1.2% compared with 1.0%). After age-adjustment, Aboriginal and Torres Strait Islander people were more likely to report cataract than non-Indigenous people (ratio 1.4). The disparity was greater between Aboriginal and Torres Strait Islander men and non-Indigenous men (ratio 1.7) than between Aboriginal and Torres Strait Islander women and non-Indigenous women (ratio 1.2). The proportion of Aboriginal and Torres Strait Islander people reporting cataract increased with age [73] from 0.9%8 among those aged 25-34 years of age to 7.4% among those aged 55 years and older. Cataract was more common among Aboriginal and Torres Strait Islander people than among non-Indigenous people in all age groups for which data were available.
Findings from the 2008 NIEHS revealed that cataract was the leading cause of blindness and the second leading cause of low vision (32% and 27%, respectively) for Aboriginal and Torres Strait Islander adults aged 40 years and older [3, 104]. The overall prevalence of visually significant cataract was 2.5%, and blinding cataract was 12 times more common among Aboriginal and Torres Strait Islander people than among the non-Indigenous population. Vision loss from cataract is most common in very remote inland areas (5.3%) and very remote coastal areas (3.8%). Differences between state and regional rates of cataract were not statistically significant [71].
The earlier 2005–2008 CAOHS estimated the overall prevalence of cataract within the Aboriginal and Torres Strait Islander population living in central Australia [67]. Overall, blindness and visual impairment were four to seven times higher than among non-Indigenous people. After excluding refractive error, cataract was the leading cause of blindness. Almost one in three participants (30%) aged 40 years or older had any form of cataract in one or both eyes. For Aboriginal and Torres Strait Islander adults aged 40 years and older, 17% were visually impaired and 6% were blind from cataract [105]. This was mainly attributable to a significantly higher rate of posterior-subcapsular cataract (PSC) in Aboriginal and Torres Strait Islander participants (20%), compared with the general Australian population (3-5%). The estimated annual incidence of vision impairment per year for cataract was 8%, with ageing the main risk factor, and diabetes as a known association with PSC formation [70].
General practice attendances, hospitalisations and waiting times
Recent evidence suggests that Aboriginal and Torres Strait Islander people are more likely to visit GPs for the management of cataract, but are less likely to receive cataract surgery than non-Indigenous people. Data from GP surveys between 2010–15 showed that eye problems accounted for 1% of the conditions for which Aboriginal and Torres Strait Islander peoples visited GPs, which was similar to the rate for non-Indigenous people [106]. The Aboriginal and Torres Strait Islander rate for cataract however, was 3.5 times the non-Indigenous rate. The BEACH survey for the period April 2008 to March 2013 revealed that, after age-adjustment, Aboriginal and Torres Strait Islander patients were 3.5 times more likely than other patients to see GPs for the management of cataract [74].
Cataract surgery rate is defined as the number of age-standardised hospital admissions for a cataract procedure per 1,000,000 population. For patients that require a cataract operation, the rate of surgery is lower for Aboriginal and Torres Strait Islander compared with non-Indigenous people, but the gap appears to be narrowing in recent years. Overall, the Indigenous hospitalisation rate for cataract surgery has risen by 36% in the last 10 years [5]. Between 2005–2008, the rate of hospitalisation for cataract among non-Indigenous people was more than six times higher than that of Aboriginal and Torres Strait Islander people [107]. In 2014–2016, the rate was 7,614 per 1,000,000 and 8,507 per 1,000,000 for Indigenous and non-Indigenous people, respectively, representing a rate ratio of 0.90 [5]. After age-adjustment, cataract surgery rates for Aboriginal and Torres Strait Islander people were lowest in major cities, and highest in the combined remote and very remote areas.
These findings correspond with an observational study from NSW, which examined data linkage for 440,551 cataract procedures performed between 2001 and 2008 [108]. This study found a significantly lower rate of cataract procedures (adjusted rate ratio 0.71, 95% CI 0.68-0.75), among Aboriginal people compared with non-Indigenous people, and the greatest disparity was in cities and less disadvantaged areas.
Cataract surgical coverage refers to the proportion of visually impaired people with cataract in both eyes who require surgery and have received it in one or both eyes. In the 2016 NEHS, the sampling-adjusted cataract surgical coverage (using the NEHS definition of visual impairment as best-corrected vision worse than 6/12 with cataract in one or both eyes) was 59% for Aboriginal and Torres Strait Islander participants, which was significantly lower than a rate of 88% for non-Indigenous participants (P<0.001) [8]. Coverage rates for Aboriginal and Torres Strait Islander participants did not differ significantly by remoteness.
With regards to waiting times, national hospital statistics from 2015–16 found a median waiting time for cataract surgery of 152 days for Aboriginal and Torres Strait Islander people, compared with 93 days for non-Indigenous people [5]. By comparison, median waiting times for 2014–15 were 142 days and 84 days, respectively [77]. Nearly half (49%) of non-Indigenous people had cataract surgery within 90 days, compared with 39% of Aboriginal and Torres Strait Islander people [5]. Aboriginal and Torres Strait Islander people from inner regional areas, and those in the lowest socioeconomic areas had the highest median waiting times [77, 109].
Prevention and management of cataract
Appropriate prevention strategies can reduce the development of cataract, and early detection and treatment can lead to improved eye health outcomes for those who have cataract.
Prevention
Preventive and protective behaviours can potentially reduce the development of cataract. Such behaviours include:
- reducing modifiable risk factors (such as tobacco smoking and sun exposure) by using protective measures [109].
- proper management of blood glucose levels for people with diabetes.
According to the 2008 NIEHS, around 22% of Aboriginal and Torres Strait Islander children and 24% of adults had never used sun protection eyewear or headwear when out in the sun [109]. Aboriginal and Torres Strait Islander people living in urban and regional areas were more likely than those living in remote and very remote areas to wear sun protection (29% of children and 28% of adults compared with 18% of children and 19% of adults) [110].
Early detection
Early detection of cataract through regular eye screening can lead to earlier treatment and better post-operative outcomes as well as patient satisfaction [111] but there can be variability in how services provide treatment.
The 2016 NEHS found that Aboriginal and Torres Strait Islander people over 40 years of age were less likely to have received an eye examination within the last two years, when compared with non-Indigenous people (67% versus 82.5%, respectively) [112]. Those with cataract were more likely to have seen an ophthalmologist rather than an optometrist, and those in outer regional or very remote locations were least likely to have been examined by any health care professional. Compared with the 2008 national survey this demonstrates that attendance for eye examinations, which can assist in the detection and referral of cataract, has in fact improved in the Aboriginal and Torres Strait Islander population [7]. However, it still lags behind that of non-Indigenous people by a significant margin.
There are four stages of treatment for cataract – (1) screening, (2) assessment, (3) surgery, and (4) follow-up [111]. For the treatment pathway to be effective for Aboriginal and Torres Strait Islander people, it is recommended that: screening is provided in culturally appropriate services and accompanied by clear information and communication; services in urban, rural and remote areas are well-funded and supported to ensure correct assessment; surgical wait times are monitored, benchmarked and kept under 90 days where possible [26]; the cost of surgery is managed appropriately, in order to minimise its impact as a barrier to access [26]; the quality and outcomes of surgery are maintained through appropriate triaging of case complexity, and adequate provision of surgical training, equipment and experienced theatre staff [113]; support is provided for patients to attend surgery (food, accommodation, transport, and social support). Follow up is also extremely important.
Treatment
Cataract is usually treated by surgery performed by an ophthalmologist. Cataract surgery is a cost-effective surgical procedure that can correct blindness. Surgery in hospitals is often performed as a day procedure under local anaesthetic, has excellent outcomes with a low complication rate, and is one of the most cost effective procedures in modern medicine [114].
There is an ongoing need for eye surgery strategies to treat cataract among Aboriginal and Torres Strait Islander people. This is particularly true in various rural and remote locations throughout Australia [111]. In these areas, cataract surgical blitzes (also known as surgical intensives) may be offered from year to year by surgical teams that visit for short periods. Expert opinion on surgical blitzes is mixed, with some recommending targeted blitzes to clear the backlog in regional areas, and others cautioning against blitzes due their short-term and unsustainable mandate [115]. There is consensus that surgical activity should be coupled with an increased awareness of regional eye health needs, and appropriate resourcing to develop sustainable surgical services. Coordination of services with case-management of patients along clear pathways of care has been identified as key to reducing patient dropout and ensuring quality outcomes in eye care [116]. Cataract surgical facilities are also recommended at the regional level [21].
The quality of cataract surgery outcomes in Australia was recently assessed in the 2016 NEHS, by way of measuring the visual acuity in eyes that had undergone cataract surgery. Poor visual acuity outcomes after cataract surgery (defined as presenting visual acuity less than 6/12, and better than or equal to 6/60) were present in 28% of Aboriginal and Torres Strait Islander participants, compared with 18% of non-Indigenous participants [117]. Very poor outcomes (presenting visual acuity worse than 6/60) were present in 6.3% of Aboriginal and Torres Strait Islander participants versus 1.9% of non-Indigenous participants. The effective cataract surgery coverage (defined as the proportion of operated cataract with a good outcome of 6/12 or better) was much lower among Aboriginal and Torres Strait Islander participants at 52%, compared with 88% for non-Indigenous participants. The main causes of poor visual outcome after cataract surgery were refractive error (42%) and coincident eye disease (40%), with the latter mainly attributable to diabetic retinopathy. Surgical complications were not found to be a cause of poor visual outcomes in any Aboriginal and Torres Strait Islander participant.
Access to surgery
The available evidence suggests that the rate of cataract surgery for Aboriginal and Torres Strait Islander people is increasing, but still lags behind that of non-Indigenous people [8]. While the hospitalisation rate for cataract surgery among Aboriginal and Torres Strait Islander patients has risen by 36% in the last 10 years, the cataract surgery rates for Aboriginal and Torres Strait Islander and non-Indigenous people were 7,614 per 1,000,000, and 8,507 per 1,000,000, respectively in 2014–2016 [5].
In the 2008 NIEHS, the prevalence of cataract surgery was 6.5%, which increased to 8.2% in the 2016 NEHS [8]. This compares with a cataract surgery prevalence of 19.8% among non-Indigenous participants in the NEHS [8]. When using the same definition of visual impairment (presenting visual acuity worse than 6/12 with cataract in one or both eyes), the national coverage rate for Aboriginal and Torres Strait Islander patients appears to have remained stable between 2008 and 2016, at 65% and 67%, respectively. Given the increasing prevalence of cataract (2.5% in 2008 versus 4.0% in 2016), the surgical coverage rate may need to further increase to meet the needs of an ageing Aboriginal and Torres Strait Islander population.
The 2016 NEHS found that Aboriginal and Torres Strait Islander people were less likely to have undergone cataract surgery than non-Indigenous people (odds ratio 0.32; P<0.001) [8]. Similarly, the 2008 NIEHS found that Aboriginal and Torres Strait Islander people were four times less likely to have surgery for cataract than non-Indigenous people [115]. In the 2016 NEHS, longer education (OR 1.09 per year; p=0.034) and age over 80 years (coverage rate of 63%) were both associated with higher cataract surgery rates for Aboriginal and Torres Strait Islander people. Geographic remoteness was associated with varying rates of coverage (e.g. 28% in very remote and 78% in remote areas), but these differences were not statistically significant.
Lower cataract surgery rates and coverage, and long waiting times reflect the poor access to surgical services experienced by Aboriginal and Torres Strait Islander people [8, 77, 108]. This is despite Australian guidelines for the monitoring and improvement of wait times for cataract surgery for Aboriginal and Torres Strait Islander patients [9].
In 2010, Aboriginal people in NSW had a higher prevalence of cataract and lower rate of cataract procedures (0.7 times lower) than non-Indigenous people [118, 119], despite an overall increase in cataract procedures for Aboriginal people between 2001–02 and 2010–11. In 2009, a study in two remote Indigenous communities in the Northern Territory (NT) (one coastal and one desert community) found a high number of people with un-operated cataract despite visits by an ophthalmologist [94].
A study of cataract procedures conducted in NSW between 2001 and 2008, found that Aboriginal and Torres Strait Islander people were admitted for cataract surgery at a younger age (mean age 67 years compared with 74 years) than non-Indigenous people [120]. They were also more likely to be a public patient, go to a public hospital, and live in a more disadvantaged area than non-Indigenous people. While cataract surgery rates were lower for Aboriginal and Torres Strait Islander people than for non-Indigenous people (rate ratio: 0.7) in most areas, their rates typically increased with increasing socioeconomic disadvantage, remoteness of residence and proportion of Aboriginal and Torres Strait Islander residents. This was attributed to increased availability of public services, targeted services for Aboriginal and Torres Strait Islander people, and greater need in these areas. The researchers have suggested that in urban areas, the concentration of cataract surgical facilities in the private sector may limit access to these services. Barriers may include inadequate cultural safety in these environments and low levels of private health insurance among Aboriginal and Torres Strait Islander people. The researchers concluded that the level of public sector service provision is likely to be the key driver of the disparity in surgery rates.
It should be noted however, that unlike the findings in NSW, a study of access to eye health services across Australia found that in the period 2005/06–2007/08, rates of cataract surgery were lowest in areas in which a high medium, high and very high proportion of Aboriginal and Torres Strait Islander people lived (6.1-10%, 10-20% and more than 20% of residents respectively) [94]. This trend is reflected in the age-standardised rates of hospital admissions for cataract surgery in 2014–2016, which were lowest for Indigenous people living in major cities, followed by inner and outer regional areas, and highest for those living in remote and very remote areas [5]. This disparity is likely to represent the heterogeneous, ‘patchwork’ provision of cataract surgical services and funding models in regional Australia, which differ at the state, regional and local levels [28].
A study conducted in 2013 performed nationwide consultations to identify health system barriers that limit access to cataract surgery for Aboriginal and Torres Strait Islander people. Barriers were identified at primary care, specialist care and hospital levels and included [107]:
- lack of awareness among health professionals at all levels regarding the demand and need for cataract surgery in urban and regional areas
- inadequate knowledge among primary healthcare workers regarding the availability of ophthalmology services
- difficulties experienced by primary healthcare workers in making appointments for patients with visiting ophthalmology services or local ophthalmology facilities
- limited surgical capacity at regional hospitals (poor access to and availability of public ophthalmology services
- poor coordination between hospital, health and eye care services
- complexity of the (patient journey) the steps/treatment process leading to surgery
- inadequate support for patients referred from primary healthcare services to specialist and hospital services
- costs associated with private ophthalmology consultations and gap fees for visiting ophthalmology services
- long waiting times for public cataract surgery and visiting ophthalmology services
- lack of consistent eye health data for monitoring and evaluation of cataract services.
As the life expectancy of Aboriginal and Torres Strait Islander people increases, a growing number of older Aboriginal and Torres Strait Islander people will be burdened by cataract, and the demand for services will increase further [104].
Future directions
Suggested strategies to address the barriers to cataract surgery involved a system-wide approach to increase provision and utilisation of services and includes [9, 104, 115, 117, 121]:
- improving regional planning for the provision of eye care services for Aboriginal and Torres Strait Islander patients
- providing education and training on regional eye health needs
- providing more specialist services in rural and remote areas to meet population-based needs
- establishing specialist clinics for Aboriginal and Torres Strait Islander patients in urban and regional areas
- reducing cataract surgery waiting lists (by prioritising Indigenous cataract patients and tracking hospital performance)
- providing opportunities for specialists to train in Indigenous clinics or remote areas to develop cultural awareness
- developing systems for effective monitoring and evaluating the outcome of cataract surgery
- provide appropriate surgical infrastructure and postoperative services to improve the quality and outcomes of cataract surgery
- providing case management and establishing support roles to assist patients to navigate the referral process and access eye care services and the hospital system.
Consultative research has recommended the expansion of existing services to meet the need for cataract surgery in Indigenous communities [9]. The researchers suggested that implementing the proposed solutions should provide adequate services, improve their coordination and increase the uptake of cataract surgery among Indigenous people, thereby reducing the levels of vision loss and blindness caused by cataract in this population. Analysis by the same research group has identified a significant shortfall in funding of almost $30 million, which is required to construct comprehensive care pathways (including those for cataract surgery) for Indigenous people [10].
A recent study from Qld demonstrated that a new cataract surgery pathway led to a dramatic increase in the cataract surgery completion rate, from 1.8% to 45% of Aboriginal and Torres Strait Islander patients referred for surgery [122]. This was achieved by integrating the surgical pathway within the local primary health care service, resulting in improved coordination and high-quality visual outcomes for patients. Other studies have recommended appropriate funding models, such as fee-for-service, safety-net or differential funding, in order to incentivise the provision of outreach ophthalmology services in Australia [123]. Strengthening the provision of annual eye screening for Aboriginal and Torres Strait Islander patients with diabetes has been shown to provide the adjunct benefit of detecting cataract in these patients, leading to increased referrals for surgery [124]. Tele-ophthalmology is an emerging strategy for improving screening and access for eye patients in rural and remote locations, with applications for non-urgent conditions (including elective surgery for cataract), and associated cost-savings for patients and the health system [125].
Diabetic retinopathy
Diabetic retinopathy (DR) is the most common microvascular complication of diabetes, whereby progressive damage to small blood vessels in the back of the eye leads to loss of vision over time [15]. DR is directly caused by diabetes, and is the leading cause of irreversible vision loss in adults of working age worldwide [126]. People with diabetes have an increased risk of developing other eye conditions, including cataract and glaucoma, but DR is the most common cause of vision loss in these patients [127]. DR progresses in stages, and any stage of severity can be associated with ‘diabetic macular oedema’ (DMO), which is a swelling of the macula area of the retina [14, 80, 128]. This is important because the macula area is responsible for high-definition, stereoscopic colour vision.
DR is a ‘silent disease’, which usually affects both eyes and often causes no symptoms until the late stages, when loss of vision has already occurred. When symptoms do occur, they are most likely to involve blurred or distorted vision in one or both eyes, and may also include: ‘floating’ spots, fluctuating vision, impaired colour vision, increased sensitivity to light, poor night vision, dark or missing areas in the visual field and sudden loss of vision altogether [127].
Diabetes is a major public health problem for Aboriginal and Torres Strait Islander people and levels of DR are disproportionately high in this population compared with non-Indigenous people. Among Aboriginal and Torres Strait Islander adults in the 2016 NEHS, the self-reported rate of diabetes was almost four times higher than among non-Indigenous people (37% vs 13.9%, respectively) [129]. This finding appears to be corroborated by self-reported and measured results from the Australian Institute of Health and Welfare, which found a 3.5 fold higher prevalence of diabetes among Aboriginal and Torres Strait Islander compared with non-Indigenous people [130]. The recent 2016 NEHS has reported that DR is the third leading cause of vision loss in Aboriginal and Torres Strait Islander patients [2]. However, up to 98% of vision loss and blindness from diabetes can be prevented with regular eye examinations and timely treatment [23, 26].
Pathology
DR occurs when changes in blood flow associated with chronically high blood sugar levels cause damage to capillaries in the retina [127]. DR is typically categorised into stages that progress in severity from non-proliferative (NPDR) to proliferative diabetic retinopathy (PDR) (Table 4) [14, 15]. NPDR occurs in the early stages, and causes blood vessels in the retina to bleed or leak fluid, but usually has no or few symptoms [15]. PDR occurs in the latter stages, it involves the development of new, abnormal blood vessels on the surface of the retina or elsewhere in the eye, and can lead to scar tissue, retinal detachment, severe bleeds and blindness [15, 127, 131].
Vision loss in diabetics is most frequently caused by DMO, [14, 127] which can occur at any stage of DR [127]. Diabetic macular oedema is caused by bleeding and leakage of damaged blood vessels and retinal tissue in the macular area. A significantly higher rate of DMO has been found in Aboriginal and Torres Strait Islander people compared with non-Indigenous people with diabetes (7.6% versus 4.9%) [132]. The reasons for this disparity are multifactorial and incompletely understood, but may be attributable to poor glycaemic control in the Aboriginal and Torres Strait Islander population coupled with possible genetic and environmental susceptibility factors [132].
The main risk factors for developing DR are the duration of time that the patient has had diabetes and having poor control of blood sugars, blood pressure and blood lipids. The risk of DR worsening increases with increased duration [14, 127]. This is considered a non-modifiable risk factor in most patients, although diabetes may be reversible in some cases through lifestyle and medical interventions [133]. Important modifiable systemic factors associated with an increased risk of DR include high blood glucose levels, followed by high blood pressure (hypertension) and elevated blood lipids [14, 127, 131]. Other risk factors include: renal disease, pregnancy and genetic factors [14]. However, the progression of DR can be delayed by following a healthy lifestyle and monitoring and controlling blood glucose, blood pressure and serum lipid levels [14, 80, 127].
DR not only causes loss of vision, but more alarmingly, may also increase the risk of death. A recent review of data from 1,347 Indigenous adults from Central Australia found a near-double increase in the risk of death over a 10 year follow-up period in people with vision loss from DR, when compared with those that didn’t experience visual loss (hazard ratio 1.7, where hazard ratio is the rate of death in people with vision loss from DR, relative to the rate of death in those with diabetes but without vision loss) [21].
Prevalence
The recent 2016 NEHS has found that the weighted prevalence of any DR (39%) among Aboriginal and Torres Strait Islander people with self-reported diabetes was higher than that reported in previous Australian studies [11]. By comparison, previous estimates of the prevalence of DR in Aboriginal and Torres Strait Islander participants with diabetes have consistently ranged between 20% and 30%. These include an estimate of 30% in the 2008 NIEHS [134], 21% in the 1996 Katherine Region Diabetic Retinopathy Study [135], 30% in a survey conducted between 2007–2009 in Qld [136], 22% in a cohort of Aboriginal and Torres Strait Islander participants in remote South Australia (SA) [137], 25% [138] and 29% [139] in a regional and urban cohort, respectively, in Western Australia (WA), and 25% in the 2005-2008 CAOHS [140]. This recent higher prevalence estimate may partly be attributable to a higher mean age and duration of diabetes in NEHS compared with NIEHS participants. The spectrum of disease severity was also skewed toward the early stages of DR, with nearly three quarters of all cases being minimal to mild NPDR. In contrast to the NIEHS, prevalence estimates from the NEHS were weighted (i.e adjusted for age, gender and the sampling rate in each remoteness stratum), to provide more representative population estimates.
Table 3. Classification and grading of diabetic retinopathy
| Stage | Clinical findings | Symptoms | Management |
|---|---|---|---|
| Diabetic retinopathy | |||
| No DR | Absence of any visible signs of DR in the retina in both eyes. | None | Review in 1 year (Indigenous patients) or 2 years (non-Indigenous). |
| Mild NPDR | Microaneurysms only (abnormal out-pouchings of blood vessels). | None | |
| Moderate NPDR | More than just microaneurysms but less than severe NPDR. | None | Repeat examination in 6 months in all patients. |
| Severe NPDR | Widespread retinal bleeding, and ‘sausage-string’ blood vessels. | Often none | Close follow-up and possible laser treatment. |
| Proliferative DR | Presence of new, abnormal blood vessels in any part of the eye. | Highly variable, from no symptoms to compete, sudden loss of vision. | Perform full laser treatment +/- further invasive eye surgery. |
| Macular oedema | |||
| Non-centre involving | Swelling of the retina, not involving the centre of the macula. | Often none; may have blurred or patchy vision. | Close follow-up and possible treatment with injections +/- laser. |
| Centre-involving | Swelling of the centre of the macula, causing vision loss. | Blurring, distortion or loss of central vision. | Regular injections of medication into the eye. |
Sources: Mitchel et al., 2008, Dirani et al., 2013, International Council of Ophthalmology, 2015, International Council of Ophthalmology, 2017 [14, 15, 127, 141]
In the NEHS, diabetes was the third leading cause of vision loss among Aboriginal and Torres Strait Islander people over 40 years of age, contributing to 5.2% of vision loss. By comparison, DR accounted for 1.5% of vision loss among non-Indigenous people over 50 years of age [2]. There was also a large disparity in the rate of self-reported diabetes among Aboriginal and Torres Strait Islander versus non-Indigenous participants (37% and 14%, respectively). In the 2012–2013 AATSIHS, among the Aboriginal and Torres Strait Islander people who reported having diabetes, 29% reported having associated sight problems1 [110]. After age-adjustment, this proportion was 2.6 times greater than the proportion reported by non-Indigenous people.
Among known diabetics in the 2016 NEHS, approximately one in 10 Indigenous participants experienced vision-threatening DR, compared with one in 20 among non-Indigenous participants [11]. DR was the main cause of vision loss in 9% and 19% of non-Indigenous and Indigenous adults, respectively [11]. The rate of vision-threatening DR appears to have declined since the NIEHS, when it was estimated at 13% [134].
In contrast, vision-threatening DR was present in only 3.5% of cases in a survey from the Kimberley region of WA [142], and in 10% of cases from a survey in the Eastern Goldfields of WA [138]. A review of DR undertaken in 2014 found that, in studies performed after 1990, a significantly higher rate of DMO was found in Indigenous compared with non-Indigenous people [132].
Longer duration of diabetes and geographical remoteness were associated with vision-threatening DR in the NEHS. Indigenous participants were found to have an odds ratio for DR of 1.05 per 1-year increase in the duration of diabetes. Those residing in more remote areas were also at higher risk of DR. The study speculated that these findings were attributed to insufficient provision and utilisation of early detection and treatment services, which have been reported in previous research [28].
Prevention and management of diabetic retinopathy
Primary care
The prevention of diabetes, through improved glycaemic, lipid and blood pressure control, will mitigate the onset and progression of DR [12]. To prevent the avoidable vision loss associated with DR, people require support to manage their systemic, whole-body diabetic control [15]. Key preventative measures at the primary care level include:
- education and lifestyle advice to promote a healthy diet and physical activity
- regular screening (taking an eye history and performing examinations)
- appropriate prescription medication to control blood glucose, blood pressure and blood lipids.
Implementation of chronic disease case management and improved needs-based planning could identify key issues within health systems and improve the primary care of Indigenous patients with diabetes [124].
Effective primary care requires access to affordable and culturally appropriate health services in both urban and rural settings. The promotion of healthy lifestyles may be impeded by cultural and language barriers, which may also lessen the uptake of subsequent eye-specific treatments, including laser and intravitreal injection therapies [137]. Improving access to and delivery of health care, and diabetes education is important in urban settings as well as rural and remote areas. More studies are needed in urban Indigenous communities [143].
Coordination of primary, secondary and tertiary services, with dedicated outreach case-managers and Integrated Care Teams (supported by the MOICDP), is likely to improve health outcomes for Aboriginal and Torres Strait Islander patients with diabetes. A feasibility study of an urban case management approach for Aboriginal and Torres Strait Islander patients with chronic disease found significant improvements in blood pressure, diabetes control and depression among patients [144]. Staff and patients also reported a high level of satisfaction with this model of care. The cost effectiveness and improved access associated with utilising a dedicated coordinator have been demonstrated in several previous Australian studies [10, 29, 145].
Health promotion
Culturally appropriate and engaging health promotion tools, created in partnership with Aboriginal and Torres Strait Islander stakeholders, are important for the prevention and management of DR. In 2015, the Indigenous Eye Health Unit at the University of Melbourne developed a suite of health promotion resources to improve eye health outcomes among Indigenous people with diabetes [146]. The Check Today, See Tomorrow resource kit [13] and associated multimedia resources were developed through a community-led process, and designed for use in clinical and community settings in urban, rural and remote areas. They aim to assist primary care providers to deliver key eye health messages about diabetes eye care.
In 2011, Lions Outback Vision in WA collaborated with Aboriginal Health Workers and community members from the Kimberley to develop a culturally appropriate health promotion video to raise awareness of DR and the importance of annual screening [147]. Evaluation of the video—called Bad sugars, bad eyes—in 2012 found that there were significant increases in patient knowledge about the visual complications of DR, need for screening and recommended screening intervals. It also found that the majority of Aboriginal Health Workers considered the video ‘very’ culturally appropriate and understandable.
Screening for early detection
The prevention and management of DR relies on the earliest possible detection of retinopathy, before irreversible damage has occurred. Early detection in turn depends on five key elements of the patient journey: screening, referral, monitoring, treatment and review [31, 124].
Regular, high-quality eye screening is critical to detect and prevent avoidable vision loss from DR. Regular eye exams are required to diagnose DR in the early stages (when it is frequently asymptomatic), monitor progression of the condition, and enable timely referral for treatment [15]. The 2008 National Health and Medical Research Council Guidelines for the management of diabetic retinopathy [14], recommend that Indigenous people with diabetes receive annual eye exams. Once DR is detected it is recommended that eye exams are conducted at 3-12 month intervals, depending on the severity of the DR.
A range of retinal photography screening programs have been trialled in settings across Australia over the last two decades. A review of programs undertaken in urban, rural and remote communities in Australia was published in 2015 [148]. It confirmed that retinal photography screening programs implemented in mainstream and Indigenous communities were highly effective at increasing the number of people who underwent screening for DR. Programs that have involved Indigenous participants have been conducted in:
- the Kimberley region of WA: demonstrating the benefit of retinal photography screening programs that rely on non-medically trained photographers [142, 149]
- Inala, Qld: opportunistic retinal photography in primary care improved access to DR screening for patients visiting an urban Indigenous health care clinic [136]
- Qld: providing an existing multidisciplinary diabetes outreach service with a retinal camera increased the rate of screening from 16% to 66% [150]
- Melbourne, Vic: a pilot of opportunistic screening in an urban pathology collection centre found 34% of diabetics had not undertaken regular DR screening, of whom 93% accepted the pilot screening service [151].
Regular annual screening for DR effectively detects the majority of other eye diseases experienced by Aboriginal and Torres Strait Islander people. Ongoing developments in retinal photography screening programs, and the advent of a new Medicare Benefits Schedule (MBS) item in November 2016 [152] to fund annual retinal screening [153] among Aboriginal and Torres Strait Islander people with diabetes, promise to improve the examination, early detection and subsequent referral of DR. The Australian Government has also promised funding for equipment (retinal cameras and slit lamps) and training that is being rolled out to Aboriginal Medical Services and GP practices between mid-2016 and mid-2019 to support the new MBS item. The advent of a new Medicare item for tele-ophthalmology may prove synergistic for the screening of retinal photographs for Aboriginal and Torres Strait Islander patients with diabetes living in rural and remote areas.
Analysis of data from the NIEHS found that three quarters of the Indigenous adults that required an annual eye examination had diabetes [154]. Among those with diabetes, 12% required further referral for cataract, 5% for uncorrected distance refractive error, and 1% for trachomatous trichiasis. The authors commented that an effective DR screening program would capture up to three-quarters of treatable eye diseases in Indigenous patients.
Attendance for retinal screening among Aboriginal and Torres Strait Islander patients appears to be improving, but remains low when compared with non-Indigenous patients. The NEHS found that 53% of adults with self-reported diabetes reported having undergone an eye examination within the previous 12 months, compared with a proportion of 20% in the NIEHS [11, 134, 155]. By comparison, 78% of non-Indigenous participants with diabetes in the NEHS adhered to the NHMRC guidelines of biennial screening. Among participants with DR, the largest disparity in attendance for examination was among patients with a milder stage of disease, where 78% of non-Indigenous participants compared with 63% of Aboriginal and Torres Strait Islander participants with mild-to-moderate NPDR accessed optometry to ophthalmology services in the last 12 months. Aboriginal and Torres Strait Islander participants residing in inner regional areas (adjusted odds ratio [aOR] 1.66, P=0.007) and male gender (aOR 1.46, P=0.018) were positively associated with adherence [155].
Treatment
The timely treatment of people with vision-threatening DR is crucial to avoid associated vision loss and blindness. People with DR are typically referred for treatment when the condition has progressed to the severe non-proliferative or proliferative stage, or when DMO occurs [15]. There are several types of treatment for PDR and DMO that can be used alone or in combination.
Intravitreal injections into the eye with anti-VEGF medications have become the mainstay of treatment for DMO [156]. These medications work by reducing the permeability of damaged and leaky retinal blood vessels, as well as reducing the chemical signals to produce abnormal new vessels within the eye. Anti-VEGF therapy consists of injecting a low volume (0.05 mL) of medication into the vitreous cavity of the eye, under aseptic conditions with local anaesthetic, in an outpatient or treatment-room facility. In addition to treating DMO, these medications also slow or reverse the severity of DR, such that they are used as an adjunct to laser treatment when managing some patients with severe NPDR or PDR [157].
While anti-VEGF agents are effective in improving vision for most patients with DMO, they have a relatively short duration of action within the eye. Consequently, they require frequent, repeated re-administration, often on a monthly basis over three or more years. This treatment burden imposes a substantial personal and financial cost for both patients and the health system [158].
Intravitreal injections of steroid medications are performed in selected cases for patients with DMO. Compared with anti-VEGF agents, steroid injections have a higher side-effect profile, including cataract formation and raised intraocular pressure. However, they can be effective in treating cases of recalcitrant DMO that have been unresponsive to conventional anti-VEGF treatment, with the added advantage of a longer duration of action, which translates to fewer, less frequent injections for patients [159].
Laser therapy is the mainstay of treatment for PDR. More complicated cases may require adjunct anti-VEGF therapy or surgery, with the most common operation being a vitrectomy (the surgical removal of the vitreous, or jelly-like substance, from the back of the eye). Encouragingly, the NEHS found similar laser treatment coverage rates between Aboriginal and Torres Strait Islander and non-Indigenous participants (75% and 79%, respectively), suggesting comparable treatment of PDR, once it has been detected [129]. The adjunct use of both laser and Intravitreal injections is rapidly becoming standard practice for advanced, vision-threatening DR. As treatment options evolve, the reliance on laser therapy to manage DR may be re-assessed [160].
Future directions
The prevalence of diabetes is predicted to increase substantially in Australia in the coming decades, with a concomitant increase in the health and economic impact of DR [161-163]. Despite recommendations regarding annual eye examinations for people with diabetes, there is as yet no national screening program [15] and screening rates for Aboriginal and Torres Strait Islander people, while appearing to be improving, remain low compared with non-Indigenous people [11]. An integrated diabetic retinopathy screening service at the national level should be considered, in order to address this discrepancy in adherence with screening guidelines.
In July 2018, the Australian Government announced $1 million in funding for the ‘Preserve Sight Program’, to promote biannual eye checks and a national electronic eye health record9. This program is a partnership between Diabetes Australia, Vision 2020 Australia, Oculo, the Centre for Eye Research Australia and Specsavers Australia, with the aim of improving the screening and early detection of diabetic retinopathy of all Australians, including Aboriginal and Torres Strait Islander peoples. In August 2018, the Government announced $2.5 million for retinal cameras and training, in order to roll out 150 cameras by 202010. This is an extension of the ongoing ‘Provision of Eye Health Equipment and Training’ program. This program is co-led with the Brien Holden Vision Institute and Australian College of Optometry, working with the Aboriginal Health Council of South Australia, Centre for Eye Health and Optometry Australia. It aims to provide eye equipment and training for primary health care clinics who provide care to Aboriginal and Torres Strait Islander people11.
The emerging role of telehealth technology may cost-effectively increase the access to and coverage of DR screening in the future. A prospective audit of an existing tele-ophthalmology service in WA found that a broad range of eye conditions (31 different diagnoses) including DR, were managed by tele-ophthalmology [164]. Tele-ophthalmology has been estimated to save the state health system over $1 million/year in WA [34]. As well as retinal cameras and smartphones, newer technology such as optical coherence tomography may have a role in remote DR screening in future [165]. TEAMSNet is a new telehealth initiative in Central Australia which aims to provide coordinated eye, heart and diabetic care [166]. Other recent studies have explored the ability of computerised image analysis software and artificial intelligence to detect diabetic retinopathy [167, 168].
Trachoma
Trachoma is a contagious infection of the eye caused by strains of the bacteria Chlamydia trachomatis, which initially affects children (‘active stage’), can recur throughout life if left untreated, and leads to scarring of the eye and loss of vision (‘late stage’) in adulthood [169, 170]. It is the leading infectious cause of blindness in the world, but Australia is the only developed country to still have endemic pockets of trachoma, defined as a prevalence of over 5% [18, 171, 172]. In Australia, trachoma is almost exclusively experienced by Aboriginal and Torres Strait Islander children [173], while trichiasis typically affects Aboriginal and Torres Strait Islander adults who live within remote and very remote communities [131, 174, 175].
Trachoma prevalence varies widely [170], but with improvements in housing, hygiene, and living conditions, it ceased to be a public health problem in most parts of Australia during the 1930s [176]. Declines in prevalence have since continued, and trachoma was not identified as a significant cause of vision loss among Aboriginal and Torres Strait Islander Australian adults in the 2016 NEHS [2]. However, trachoma has historically been the leading cause of blindness among Aboriginal and Torres Strait Islander people, continues to be reported in some remote and very remote communities in the NT, SA and WA, and was identified in NSW and Qld (where it was thought to be eradicated) as recently as 2008 [172, 177]. Furthermore, more communities with endemic and hyperendemic levels of trachoma were found in 2017 when compared with 2016 (see Prevalence of active trachoma section), indicating the need for ongoing work in this area.
There are a range of determinants that underlie the prevalence of trachoma in remote communities and pose barriers to its elimination. The broad socioeconomic inequities that contribute to trachoma are inherently difficult to measure and address, and implementing interventions that result in sustainable improvements in remote communities remains an ongoing challenge [175].
Repeated trachoma infections over an extended period of time can lead to contraction, distortion and severe scarring of the eyelids, and in-turning of the eyelashes (a condition called trichiasis), which can damage the cornea and lead to blindness if not treated with surgery [178]. The threshold number of repeated infections for the manifestation of trachomatous scarring and trichiasis has been estimated at 102 and 151 episodes, respectively, suggesting that children in hyperendemic areas become re-infected frequently [179].
Trachoma is easily spread from person to person through: close facial contact and hand-to-eye contact; sharing of clothing, linen and bedding; and flies [172, 180]. The association between trachoma and poor environmental conditions is well established. Factors that contribute to the spread of trachoma include: lack of clean water for bathing and general hygiene, dry dusty conditions, inadequate sewerage facilities, household overcrowding, and high numbers of flies [118, 172, 173, 181]. The regular movement of people between communities is also believed to be an important factor sustaining endemic trachoma in Australia [182].
Trachoma is not a nationally notifiable disease [176], but trachoma surveillance and management have been undertaken since 2006 by the National Trachoma Surveillance and Reporting Unit (NTSRU). Trachoma is diagnosed clinically or through laboratory examinations [176] and its prevalence and severity is assessed according to the Simplified Grading System by the World Health Organization (WHO) [178].
Classification of trachoma
Trachoma is classified into five clinical stages according to the WHO guidelines [131, 178]:
1. trachomatous inflammation – follicular (TF): current active infection requiring antibiotic treatment
2. trachomatous inflammation – intense (TI): severe recurrent infection with an increased risk of scarring; requires antibiotic treatment
3. trachomatous scarring (TS): presence of scarring in the conjunctiva under the eyelids. The patient has or has had trachoma, and will need to be regularly reviewed to identify and deal with possible progression to trichiasis.
4. trachomatous trichiasis (TT): where at least one eyelash rubs on the eyeball, which can cause corneal opacification (scarring) through repeated mechanical trauma and a repeated corneal infections.
5. corneal opacity (CO): a disabling whitish lesion affecting the cornea (clear window at the front of the eye ), which can result in loss of vision and blindness if it covers the pupil.
Prevalence and incidence
The NTSRU collects annual prevalence data for trachoma and trichiasis from communities that are at risk of endemic levels of trachoma [183]. Non-Indigenous people are no longer at risk of developing trachoma and are therefore excluded from data collections [184, 185]. For active trachoma, the 5-9 year old age group is the target group for screening programs in all regions, with variable screening undertaken for other age groups.
Incidence data are limited, but between July 2005 and June 2008 the CAOHS estimated an annual incidence of visual impairment due to trachoma of 0.7% (31 new patients per year) in people aged 20 years and older, and 0.9% among those aged 40 years and older. Trachoma was responsible for 2% of the bilateral visual impairment that developed in study participants between July 2005 and June 2008 [69, 70].
Prevalence of active trachoma among Aboriginal and Torres Strait Islander children
The 2008 NTSRU survey included data from 16 regions and 287 remote Aboriginal communities from the NT, SA and WA. The prevalence of active trachoma in these communities was 21% overall, with 82 communities (68%) having a prevalence of active trachoma of 5% or greater [16]. The 2008 NIEHS found an overall prevalence of active trachoma of 3.8%, with endemic levels in one-half of very remote communities [71]. Aboriginal and Torres Strait Islander children aged 5-15 years in 30 communities were screened and active trachoma was reported in all states and territories, except Tasmania. Prevalence ranged from 0.6% in major cities to 7.2% in very remote coastal and 7.3% in very remote inland communities. The highest prevalence was 23% in a very remote inland NT community and 13% in a very remote coastal WA community [71, 186]. In Qld, prevalence of 9.3% and 10% was reported in two remote coastal communities. In NSW, trachoma was reported in a major city (1.6%), and in an inner regional area (3.6%). Two people were blind in both eyes (VA <6/60) from trachomatous scarring in both eyes, which accounted for 9% of bilateral blindness in the NIEHS.
In 2014, the overall prevalence of trachoma among children aged 5-9 years screened in 125 communities was 4.7% [172]. The prevalence was highest in the NT (5.9%), followed by SA (4%) and WA (2.9%). No active cases of trachoma were detected in NSW. Endemic levels were reported in 38% of the communities. Between 2013 and 2014 there was a small increase in trachoma prevalence after several years of decreasing prevalence. This increase should be interpreted with caution given the potential for error associated with the surveillance procedures.
In 2015, a total of 159 children aged 0–14 with active trachoma were found [177]. This was 2.6% of 0–4 year olds screened (18 children), 3.7% of 5–9 year olds screened (118 children), and 1.5% of 10–14 year olds screened (23 children). The prevalence was highest in SA (7%), followed by WA (4.4%) and NT (2.5%). There were no children with active trachoma in NSW.
The most recent prevalence data for trachoma were collected in 2017 from 130 at-risk communities in NT, SA, WA and QLD [17]. Between 2009 and 2017, the overall prevalence of active trachoma in children aged 5-9 in all at-risk communities declined from 14% to 3.8% [5, 17, 177, 187]. However, there were more communities with endemic and hyperendemic levels of trachoma (56 and 15, compared with 60 and 17 in 2016 and 2017, respectively). No trachoma was reported in children aged 5-9 years in 39% of at-risk communities. The prevalence was highest in the NT (5%), followed by WA (4.1%) and SA (1.6%). There were no children with active trachoma in Queensland.
Prevalence of trachomatous trichiasis among Aboriginal and Torres Strait Islander adults
In 2008, the NIEHS reported a prevalence for TT of 1.4%, which was responsible for 9% of blindness among Aboriginal and Torres Strait Islander adults aged 40 years and older [186]. The overall prevalence of TS and CO was 15.7% and 0.3%, respectively. The highest prevalence of TT was 58.3% in WA; TS was 14.6% in the NT, and CO was 3.3% in WA. These results are likely to be comparable to findings of the 2016 NEHS, due to comparable methodologies and similar examination rates achieved [188].
The 2016 NEHS has reported a prevalence of 0.17% (3 participants) for TT, among 1,738 Aboriginal and Torres Strait Islander people aged 40 years and older [188]. This represents a projected prevalence in the total population of 0.03%. The NEHS examined people from 30 randomly selected sites, and performed trachoma grading. All three participants with TT were female and had likely spent their childhood in remote areas. None of the examined participants suffered from CO, and TT was not confirmed as a cause of visual loss for any of the three affected participants.
From 2010 to 2017, the prevalence of TT fell from 2.1% to 0.5% [177, 183]. In 2017, of the 15,485 adults aged 15 years and over examined in at-risk communities, 50 cases of trichiasis were detected (44 among those aged 40 years and over) and surgery was reportedly undertaken for 9 people.
Table 4. Trichiasis screening: coverage, prevalence and treatment among Indigenous adults aged 40 years and older in the WA, SA and NT combined, 2012–2017
| 2012 | 2013 | 2014 | 2015 | 2016 | 2017 | |
|---|---|---|---|---|---|---|
| Number of communities screened | 108 | 143 | N/A* | 103 | 146 | 135 |
| Adult population (40+ years old) | 13,406 | 12,717 | 12,596 | 13,694 | 14,640 | N/A* |
| · Adults examined
· (% of population) |
4,468 (31) | 3,856 (30) | 5,151 (41) | 4,544 (33) | 5,774 (39) | 8,270 (N/A*) |
| · Adults with trichiasis (%) | 94 (2) | 49 (1) | 47 (0.9) | 39 (0.9) | 62 (1.1) | 44 (0.5) |
| · Offered ophthalmic consultation | 82 | 28 | 35 | 25 | 45 | 23 |
| · Surgery in past 12 months | 16 | 31 | 16 | 13 | 12 | 9 |
*Data not available or reported
Source: Cowling, 2016 [187]
A number of specific studies undertaken in the last decade also provide information about trichiasis:
- In 2008, 20 new cases of trichiasis were reported in the Kimberley region of WA; 13 were reported in 2009 and 2010 [189].
- Between July 2005 and June 2008, estimates of the prevalence of TT and CO among Indigenous people aged 20 year and older living in 30 remote communities in central Australia were 6.1% and 3.3% respectively [190]. However, prevalence varied widely between communities, from 0% to 33% for TT and 0% to 27% for CO. CO was a leading cause of bilateral blindness (13%) after refractive error (36%) and cataract (26%) [67].
- In 2005–06, TS was present in 78% of Aboriginal people aged 40 years and older living in a remote desert community in the NT, and in 26% of those living in a remote coastal community [94]. In the desert community, 10% of people had TT, including 6% with CO.
- In 2003, 54% of Indigenous adults aged 40 years and over living in a desert community in Central Australia had TS, 8% had TT and 3% CO [191].
Prevention and management of trachoma
The primary purpose of trachoma control activities is to prevent repeated episodes of reinfection, treat blinding conditions and ultimately eliminate trachoma in communities where it is currently endemic [131]. The prevention and management of trachoma is ideally implemented through a comprehensive community-based primary health care system that provides screening, treatment, health promotion and surveillance activities, while building community capacity [131, 172]. Each jurisdiction currently undertakes trachoma prevention and management activities according to its respective protocols and the 2014 Communicable Disease Network of Australia (CDNA) guidelines [18, 183].
The CDNA guidelines provide recommendations for medical practitioners, primary health care professionals, and regional public health units to ensure consistent trachoma prevention and management. The guidelines adapt the World Health Organization’s ‘SAFE’ strategy for trachoma to the Australian context. The SAFE strategy has been shown to be an effective tool for the reduction of trachoma in other countries [192]. It is a comprehensive set of four control measures that are listed in ascending order of priority [131, 178]: Surgery to correct trichiasis (S), Antibiotic treatment for trachoma (A), Facial hygiene (F), and Environmental improvements (E).
A study which assessed the A, F and E components of the SAFE strategy in two Aboriginal communities in the NT, confirmed that the A and F components combined were effective in reducing the prevalence of trachoma in those communities. However it was equivocal about the benefits of the E component [193]. A separate qualitative study conducted in the NT found that individuals responsible for delivering trachoma control programs (TCP) considered it to be a low priority [194]. Reasons included despondency at not being able to influence the ‘E’ component, the need to prioritise more urgent activities, lack of coordination of the TCP, and inadequate staffing and training.
Prevention activities
Vision loss and blindness from trachoma are avoidable through implementation of the SAFE strategy at the primary level, secondary and tertiary levels [18]. At the primary level, implementing the ‘F’ and ‘E’ components requires access to water, improvements in environmental conditions and hygiene, and increased health and education activities. Improvements in these factors are linked with reductions in the prevalence of trachoma [131, 195].
‘F & E’: improving facial hygiene (F) and environmental conditions (E)
Primary prevention interventions that address hygiene include promoting facial cleanliness, especially among pre-school and school children [131]. Facial cleanliness is assessed by the presence or absence of dried nasal discharge and ocular discharge on the face. A recent systematic review of the promotion of facial cleanliness for the prevention of active trachoma in endemic communities included randomised controlled trials from Australia [196]. This study found that having clean faces, when combined with the use of topical antibiotics, reduced the rate of ‘severe’ active trachoma, when compared with topical antibiotic use alone (odds ratio 0.62, confidence interval 0.40 to 0.97). The promotion of facial cleanliness was also associated with an increased prevalence of clean faces among children at 12 months follow up, with the emphasis on the outcome of a clean face, rather than the process of washing.
In 2015 in Australia, a total of 3,755 Indigenous children aged 5‐9 years in at‐risk communities were examined for clean faces. The overall prevalence of clean faces was 81%, with 85% in the NT, 72% in SA and WA and 89% in NSW [177].
It is recommended that such interventions consider the impact of water availability and behavioural change strategies. The locally supported construction of swimming pools in remote communities has been proposed as a way to help improve facial cleanliness and reduce trachoma rates in communities where it is endemic or hyperendemic, but trials are needed to evaluate the efficacy of such interventions [175]. Interventions like this could conceivably form part of the comprehensive primary health care approach that is required to address trachoma.
Education initiatives are also needed to explain trachoma and its transmission, and how water can be used to improve personal hygiene, general cleanliness and sanitary practices [131]. A survey of knowledge, attitudes and practices of staff in clinics, schools and community workplaces in the Katherine Region of NT found that many staff from clinics and schools were unaware they lived in a trachoma endemic area and considered it normal for children to have dirty faces [197].
It is recommended that education be provided to children, carers, community members, and clinic and school staff [18]. Consideration should also be given to addressing overcrowded housing and poverty in remote communities [175, 198].
The single most important primary prevention measure to improve environmental conditions is increasing the availability of water (including maintenance of pipes, taps, toilets and showers) in houses, schools and other facilities. Other primary prevention recommendations to improve environmental conditions include [131]:
- providing covered, well-maintained and functioning toilets
- providing garbage collection and disposal
- improving animal hygiene
- controlling dust (e.g. by planting vegetation)
- reducing the presence of flies (fly control programs include insecticide spraying)
- providing functional and suitable housing.
Health promotion activities
In 2015, health promotion activities occurred in 94 communities, including at-risk and not at-risk communities across NT, SA and WA [177]. Most health promotion activities were delivered to children, and childcare, preschool or teaching staff. Health promotion activities that encourage face washing are currently being delivered to health professionals, community staff, children and their caregivers/parents. The activities include interactive group sessions, presentations, social marketing and sporting/community events. Prior to this, the efficacy of a multi-component health promotion strategy for trachoma was evaluated in 63 Aboriginal communities in the NT [199]. This consisted of health promotion initiatives delivered to 272 health, education and community support staff between 2010 and 2012. The pre-post evaluation found a significant increase in appreciation of face washing (62% vs 70%, P=0.047), and capacity to teach others about trachoma prevention (71% vs 83%, P<0.001).
Variation in the quality and cultural appropriateness of trachoma health promotion resources has been identified as a barrier to the elimination of trachoma in remote communities [200]. In 2010, a collaboration between the Katherine West Health Board (KWHB), the Indigenous Eye Health Unit (IEHU) and the Centre for Disease Control Northern Territory (CDC NT) led to the launch of a toolkit to support regional programs to eliminate blinding trachoma. Members of an Aboriginal Reference Group played a central role in ensuring the resources would be relevant, understandable and effective in a remote community context. The toolkit has been designed for clinic staff and clients, schools and preschool staff, children and families, community elders, local councils and other community stakeholders. Called the Trachoma Story Kits, the toolkit brings together clinical, cultural and community knowledge and practices with key messages showing how trachoma can be eliminated using the SAFE strategy. The kits have been distributed across the NT, WA, SA and Qld, and are now provided free by the Commonwealth government by online order [201].
Since 2010, prominent Indigenous Australian AFL players have been appointed as trachoma ambassadors, and the Melbourne Football Club and the Australian Football League (AFL) hygiene clinics have been used in the NT to support health promotion efforts to eliminate trachoma [198]. The clinics have been designed to provide a fun, supportive environment to engage children in health promotion activities that address the importance of hygiene and clean faces. Community engagement in the lead up to these clinics is considered critical to their success, but it is acknowledged that evaluating the effectiveness of the program in improving facial cleanliness is difficult. It is proposed that behaviour change in young children will require sustained effort from families, maternal and child health services, schools, health clinics and the broader community.
Management activities
Management of trachoma at the secondary and tertiary levels requires early detection and antibiotic treatment, and surgery to treat trichiaisis, respectively [185]. The 2014 CDNA guidelines [18] detail these priorities as follows:
- regular screening of at-risk communities for active trachoma
- appropriate antibiotic treatment of individuals with active trachoma
- detection, referral and surgical intervention for people with trichiasis.
Screening for active trachoma
Active trachoma cases are identified through screening children aged 5-9 years who are in at-risk communities at the time of screening [18, 172]. The guidelines recommend that screening is conducted on a community-wide basis in a short time-frame in order to interrupt transmission of the infection [18]. Screening is typically undertaken through primary school‑based initiatives where the focus is on children aged 5-9 years, although screening of older (10‑14 years) and younger (0‑4 years) children also takes place. Screening coverage of 85% is recommended. The prevalence of active trachoma among children in the community between 5 and 9 years of age determines the need for, and frequency of, ongoing screening and treatment (Table 6). Treatment can be initiated without screening where trachoma prevalence is already well established [172].
Table 5. Screening and treatment schedule of contacts according to prevalence
| Trachoma prevalence in screened children aged 5-9 years | Treatment | Treatment frequency | Screening frequency |
|---|---|---|---|
| ≥20% | Single-dose azithromycin to people >3kg living in houses with children <15 years of age | 0, 6, 12, 18 & 24 months | Screen at 36 months after the initial screen (12 months after the 5th treatment) |
| ≥5 to <20% and there is no obvious clustering of cases | Single-dose azithromycin to people >3kg living in houses with children <15 years of age | 0, 12 & 24 months | Screen at 36 months after the initial screen (12 months after the 3rd treatment) |
| ≥5 to <20% and cases are obviously clustered within several households and health staff can easily identify all household contacts of cases | Single-dose azithromycin to people >3kg living in houses with an active trachoma case | Once at 0 months. Further treatment determined by prevalence at next screen | Screen at 1 year to determine prevalence |
| <5% | Single-dose azithromycin to people >3kg living in houses with an active trachoma case | Once at 0 months and retreat if trachoma is found on further screening | Screen at 1, 3 and 5 years, then cease if prevalence <5% at each screen |
Source: CDNA National Guidelines for the Public Health Management of Trachoma. Australian Department of Health, 2014 [18]
In 2017, 85 remote Indigenous communities in the NT, SA, WA and QLD were identified as being at-risk of trachoma and in need of screening [183]. Screening was undertaken in 84 of these communities, and 2,872 (83%) of an estimated 3,458 resident children aged 5-9 years were screened, which was lower than the screening coverage in 2016 of 91%. Regions that achieved the recommended screening coverage of 85% or over were WA and QLD, while NT and SA achieved coverages of 81%.
‘A’: Antibiotic treatment of active trachoma
The CDNA guidelines recommend that cases of active trachoma and their contacts are treated with a single-dose of the antibiotic azithromycin [18]. Whether treatment is needed for the household contacts of active cases only, or for all households with children under the age of 15 years, is determined by trachoma prevalence and the extent to which cases are clustered within households, as is the need for future treatment. The World Health Organization recommends a trachoma prevalence of 10% as the threshold for initiating mass antibiotic distribution [185].
It is important that all cases and contacts commence treatment within a week of each other, and that community-wide treatment is completed within two weeks. As the population in remote communities is highly mobile, treatment is recommended within these timeframes to minimise the likelihood of reinfection and achieve higher population coverage. The treatment target is 100% of active cases and 85% of contacts.
In 2017, antibiotic distribution took place in 73 communities, or 99% of those requiring antibiotics according to the Guidelines [17]. All children found on screening to have trachoma (139) received azithromycin. Jurisdictional trachoma programs delivered a total of 9,297 doses of azithromycin in 2017, which was fewer than the 11,671 doses delivered in 2016, but higher than the 8,881 doses delivered in 2015.
Screening for trachomatous trichiasis
The CDNA Guidelines recommend trichiasis screening for Indigenous adults over 40 years of age, who lived in a remote community during childhood [18]. Screening should be conducted annually by primary health care providers. The guidelines highlight the importance of ongoing, regular trichiasis screening to identify this slowly progressing condition.
In 2017, 15,485 adults aged 15 years and over were screened for trichiasis, in 135 at-risk and previously at-risk communities [183]. This figure does not include trichiasis undertaken as part of the Adult health check MBS item 715. For this reason, screening for TT is believed to be greatly under-reported [172]. Among those aged 40 years, 0.5% were reported to have trichiasis, which was improved when compared with a prevalence of 1.1% in 2016 [202].
‘S’: Surgery for trachomatous trichiasis
Scarring of the cornea due to trichiasis is irreversible, but eyelid surgery performed by ophthalmologists can prevent further damage to the cornea if undertaken in the early stages [172]. Successful surgery reduces the risk of progressive corneal opacity, prevents blindness and improves quality of life [169]. The CDNA guidelines recommend that cases of trichiasis are referred for ophthalmological assessment and surgery [18]. Trichiasis surgery is typically quick and requires only a local anaesthetic [131]. It can be performed in a community clinic if there are appropriate facilities, or in a hospital. Trichiasis may recur however, and annual follow-up is required to detect the need for further surgery.
In 2017, nine Indigenous adults (aged over 15 years) from the NT (7) and SA (2) were reported to have undertaken surgery for trichiasis in the preceding 12 months [183]. In total, 23 adults were offered ophthalmic consultation for TT, of whom one declined the offer. It has been noted that the reporting of referral and surgery for trichiasis is limited due to incomplete data collection and compilation.
Future directions
In recognising that trachoma is a disease of poverty, the Australian Government has made a commitment to eliminate blinding trachoma in Australia by the year 2020 [18]. The recently revised CDNA guidelines are believed to have strengthened trachoma control programs by reducing ambiguity and providing clear guidance on screening and treatment methods [172]. Improvements in data quality and program delivery were reported in 2015, with increased coverage of screening, treatment and health promotion activities in all jurisdictions. In 2015, the proportion of screened children aged 5-9 who had clean faces increased marginally in the NT, and decreased in SA and WA.
The NTSRU suggests that Australia is on track to eliminate trachoma by 2020. It recognises, however, that areas in which trachoma is still endemic will require continued efforts that include antibiotic distribution, health promotion and environmental improvements to enable facial cleanliness [177]. It also recognises that the impact of new strategies, in particular treatment and screening schedules, may not be evident for several years [172].
Findings from a recent evaluation of trachoma control activities argue against the current optimism, suggesting that the current national strategy is unlikely to adequately reduce trachoma prevalence in hyperendemic communities by 2020 [182]. The researchers involved in the evaluation propose a shift in intervention priorities and an increase in the intensity of activities, to increase the chance of trachoma control in hyperendemic communities. They believe control is most likely to be achieved by combining a large-scale antibiotic distribution program with increased screening, treatment, facial cleanliness and housing construction targets. While it remains unclear whether the national goal of controlling trachoma by 2020 will be achieved [182], there is broad consensus that its elimination will require multi-sectoral collaboration, targeted research, solutions to identified barriers and community engagement [169, 194].
National and multi-state eye programs and services
Programs and services for eye health are spread over government, non-government and private institutions and are undertaken in urban, regional and remote areas around Australia. They range from clinical settings (hospitals, GP clinics and AMSs) and outreach services to remote communities. More recently services are becoming available through programs that use new technologies. Many programs are for the general population, however are inclusive of Aboriginal and Torres Strait Islander people. This section provides a summary of programs and services that are providing eye health services in Australia.
Spectacle subsidy and assistance schemes are available in each state and territory of Australia. Each scheme has varying criteria which provides eye care and medical aids for patients at a low cost, or no cost in some cases [203]. In 2016, Optometry Australia launched standards for a nationally consistent subsidised spectacle scheme, endorsed by the National Aboriginal Community Controlled Health Organisation and VISION2020 Australia. The OA also provides resources for optometrists to promote the use of telehealth, and to support the use of the GP MBS item number for diabetic retinopathy photograph screening [204].
In Victoria (Vic), the Australian College of Optometry provides an outreach services program for Aboriginal and Torres Strait Islander people in rural and regional areas of Vic [205]. This is complemented by the Victorian Spectacle Subsidy Scheme, which delivered approximately 200 pairs of spectacles per month in 2016. Also in 2016, advocacy from the Indigenous Eye Health Unit at Melbourne University led to the creation of a direct cataract surgery referral program at the Royal Victorian Eye and Ear Hospital, for patients from the Victorian Aboriginal Health Service. Also, the Victorian Aboriginal Community Controlled Health Organisations secured ongoing funding for a state-wide eye health coordinator.
In NSW, the Outback Eye Service (OES) has been running for over 10 years delivering regular and culturally appropriate ophthalmology services in Bourke, Walgett, Lightning Ridge, Brewarrina, Dubbo and Cobar. In 2016, the OES completed approximately 120 eye surgeries, introduced an oculoplastic surgical list, a new paediatric eye clinic in Bourke, and continued to include a Rural Eye Registrar position, plus coordination with the Visiting Optometry Scheme. The Regional eye health program (www.wachs.net.au/regional-eye-program), coordinated by the Wellington Aboriginal Corporation Health Service, provides culturally appropriate eye health screening and treatment services to Aboriginal people throughout central NSW.
Since 1999, the Brien Holden Vision Institute has run the Aboriginal Vision program, which provides optometry services in both NSW and the NT. The program conducts clinics within primary health care facilities (Aboriginal medical services or government run clinics), is staffed by over 100 visiting optometrists, provides education for Regional Eye Health Coordinators and reports over 35,000 examinations in NSW and over 10,000 in the NT to date.
Established in 2002, the Vision Initiative (www.visioninitiative.org.au) is an integrated eye health promotion program that is funded by the Victorian government and managed by Vision2020 Australia. It was developed as a response to the National framework for action to promote eye health and prevent avoidable blindness [206], and delivers projects in regional areas of Vic. The Vision Initiative utilises a three-tiered approach to provide eye health promotion to individuals, primary care providers, and local media. Its approach was demonstrated by way of pilot projects in 2012–2015 [207], and expanded for 2015–2019.
In WA, several programs deliver eye health services for Aboriginal people. These include the Lions Outback Vision program (https://www.outbackvision.com.au), based at the Lions Eye Institute, which coordinates trips to most regions by visiting specialists, and includes the Vision Van (a mobile ophthalmology clinic), diabetic retinal screening, and metropolitan clinics at Derbarl Yerrigan Health Service. The West Australian Country Health Service supports specialist trips to the Kimberley, Pilbara and Goldfields regions. The Federal Government supports the Visiting Optometry Scheme to all regions. These programs aim to collaborate closely with AMSs, local optometrists and country hospitals to provide culturally appropriate services.
In Qld, the Cape York Regional Eye Health Program is a successful long running service that visits 29 remote communities. Optometrists, ophthalmologists and health care workers visit annually to provide basic eye care and set up times patients for operations (mainly cataract procedures and laser treatment for diabetic retinopathy). The program is a federal/state cooperative, run by a community controlled Aboriginal Heath Service (https://www.wuchopperen.org.au/our-clinics). In Brisbane, a metropolitan eye service based at the Inala Indigenous Health Service provides comprehensive eye care for Indigenous patients [136]. Since 2014, the IDEAS Van (a mobile ophthalmic treatment facility) (https://www.ideasvan.org) has been visiting 51 population centres, with a focus on diabetic retinopathy, cataract and refractive error, treating over 2,200 patients during 2014–2016. In 2016, new pathways were created for timely cataract surgery for Indigenous patients, resulting in 150 surgeries for urban patients, and 140 surgeries for regional patients.
In Central Australia, hospital-based and outreach eye services are coordinated through the Central Australian and Barkly Integrated Eye Health Services. The program provides visiting services to over 30 remote communities, with regular surgery in Alice Springs and Tennant Creek, a portable retinal camera for diabetic screening, and support from optometrists and a dedicated Aboriginal Liaison Officer. The service also trains rotating registrars (junior ophthalmology doctors) from SA, and also hosts ophthalmology fellows (senior trainees) who are supported by the Fred Hollows Foundation.
In SA, the Aboriginal Health Council of South Australia AHCSA provides the Eye Health & Chronic Disease Specialist Support Program (EH&CDSSP), and collaborates with Sight For All (https://sightforall.org) in the planning and delivery of eye disease awareness and prevention campaigns for Indigenous communities.
In the NT, specialist eye services are based at Royal Darwin Hospital, in partnerships with the Danila Dilba Health Service (http://ddhs.org.au). This program coordinates and delivers eye health services, education and promotion, in the great Darwin area and to remote Top End Indigenous communities. In 2016, 56 outreach visits were conducted to 34 rural communities, seeing over 1,400 patients. Services are also provided at Katherine Hospital and Gove District Hospital. Other eye health programs are provided through collaboration with Anyinginyi Aboriginal Health Corporation in the Barkly region, Central Australian Aboriginal Congress in Alice Springs and Wurli Wurlinjang Health Service in Katherine. Of particular note, is Alice Springs ophthalmologist, Dr Tim Henderson, who in 2018 received a Medal of the Order of Australia at the Queen’s Birthday honours for his contribution to Indigenous eye health.
Policies and strategies for addressing eye health problems
Currently, almost all Aboriginal and Torres Strait Islander eye health policy development comes under the auspice of the Commonwealth Government. Individual jurisdictions have, to varying extent, developed their own plans and services, either as Indigenous-specific actions or as services situated within the mainstream health strategies. The jurisdictions are also responsible for running the low cost spectacle schemes that vary greatly in equity and efficiency. More recently, concerted plans have been developed to provide action across all levels of government.
An important publication, A critical history of Indigenous eye health policy-making, published in 2011, provides an in-depth review of Indigenous eye health policy over a 30 year period, from 1980 to 2010 [208]. Selected information on some of the key developments in the area of Indigenous eye health policy is included below; it is not inclusive of all developments in the area.
National Framework for Action to Promote Eye Health and Prevent Avoidable Blindness and Vision Loss
‘Vision 2020: the Right to Sight’ was developed in 1999, as a global initiative between the World Health Organization and the International Agency for the Prevention of Blindness. It consisted of a World Health Assembly resolution that set the international community on a path towards elimination of avoidable blindness by the year 2020 [209]. In response to this development, the Australian Health Ministers’ Conference agreed to develop a national action plan for the prevention of eye disease and avoidable blindness, and the promotion of eye health [210].
The National Framework for Action to Promote Eye Health and Prevent Avoidable Blindness and Vision Loss was developed in 2005 by a collaborative team of representatives from the government, private and non-profit sectors, training institutions, and health care professions [210]. Key action areas outlined in the framework included:
- reducing the risk of eye disease and injury
- increasing early detection
- improving access to eye health care services
- improving the systems and quality of care, and
- improving the underlying evidence base.
The focus on prevention was deliberate, a move away from provision of rehabilitation services, which became the province of the states and territories, and towards a strategic goal of reducing the rates of blindness. Aboriginal and Torres Strait Islander peoples are nominally included in this National framework [210].
In 2014, the National Framework Implementation Plan was endorsed by the Australian Government to set out priorities for 2014–2016 [99]. In particular, it supported preventing eye disease due to diabetes and establishing a strong evidence base through the2016 NEHS.
National Eye Health Initiative
In 2006-07, $13.8 million was provided for four years to promote eye health and strengthen service care delivery [206]. This grew out of strong recommendations from the Centre for Eye Research Australia, based on the results of the Melbourne VIP and the Blue Mountains Eye Study [211], culminating in a pair of Access Economics reports on the cost effectiveness and need for eye care interventions in Australia [212, 213]. It was the catalyst for the Commonwealth Government’s National Eye Health Initiative (NEHI), which started several programs from 2006-2010. Funding was given to several organisations and the first campaign to promote eye health was the National Eye Health Awareness Campaign, launched in 2009. The National Trachoma Surveillance Unit was established and the National Guidelines for the Public Health Management of Trachoma were developed with the first report released in 2006 [184], and updated in 2014, to provide minimum best practice approaches for the management of trachoma [18]. Aboriginal community controlled organisations (ACCHOs) were funded for early detection of eye problems and primary health care, outreach services were funded and there was the Expansion of the Visiting Optometrists Scheme (VOS) for Indigenous Australians, and the Medical Specialist Outreach Assistance Program (MSOAP) [206].
Vision 2020 Australia
Vision 2020 Australia was established in 2000 and has made a number of recommendations to the Commonwealth which are relevant to Aboriginal and Torres Strait Islander eye health policy development [209]. In response to the outcomes of the 2008 NIEHS [3], and a parallel report from the Indigenous Eye Health Unit [71], a national workshop in 2010 produced a Vision 2020 proposal report called Improving outcomes for Aboriginal and Torres Strait Islander eye health and vision care. This report, identified four key areas for action: (1) patient care pathways, (2) coordination, structure, training and support, (3) information management and reporting, and (4) coordination and education at a national level [214].
More recently Vision 2020 Australia put forward the Progressing Aboriginal and Torres Strait Islander eye health and vision care: policy and funding proposal, 2013, with recommendations for improving coordination and referral pathways, improving accessibility of services, the elimination of trachoma, and governance and evaluation [215]. In 2015, the ‘Close the Gap in Aboriginal and Torres Strait Islander Eye Health and Vision Care Sector Funding Proposal’ was released by Vision 2020 Australia. This proposal tabled eight recommendations, five of which were costed, with a recommended additional annual investment of $4.65 million. Recommendations included ongoing funding for service provision of outreach eye health services, the coordination of these services at regional and community levels, and an oversight function for monitoring and support, to sit within the Australian Health Ministers’ Advisory Council [216]. In 2017, a policy submission called ‘Closing the Gap in Eye Health and Vision Care by 2020’ was released, with recommendations which included the availability of culturally safe eye health services, targeted investment in coordination, and a nationally consistent subsidised spectacle scheme [217]. In April 2018, a discussion paper titled Vision 2020 Australia submission to Closing the Gap Refresh was released [218]. Recommendations included true consultation with Aboriginal and Torres Strait Islander people to co-design the refreshed Close the Gap strategy, investment in data collection and analysis for eye health indicators, and a focus on Aboriginal and Torres Strait Islander people with low vision and other disabilities.
Improving eye and ear health services for Aboriginal and Torres Strait Islander people for better education and employment outcomes
In 2009, the implementation of the Improving eye and ear health services for Indigenous Australians for better education and employment outcomes measure expanded eye and ear health services for Indigenous people, providing $58.3 million over four years, with $16 million toward trachoma elimination in Indigenous communities. Other components of the funding saw the expansion of the Visiting Optometrist Scheme, and eye surgery intensives in the NT [219]. In 2013, a further $16.5 million was committed by the Commonwealth Government to continue and expand trachoma control initiatives [172]. This was further extended in late 2016, with an additional $20.8 million for trachoma activities for four years until 2021 [183].
Visiting optometrists scheme expansion for Aboriginal and Torres Strait Islander people
The Visiting optometrists scheme (VOS) was established in 1975 to provide support for optometrists to deliver outreach optometric services to remote and very remote locations [220]. The VOS expanded its scheme in 2009 to incorporate Indigenous people (VOS expansion for Indigenous Australians) with additional funding from the Improving Eye and Ear health services for Indigenous Australians for better education and employment outcomes measure. It aims to provide new and increased numbers of optometrist visits to Indigenous People in remote and very remote communities. This is achieved by addressing some of the financial disincentives incurred by participating optometrists providing outreach services [220]
The VOS is supported by the Rural Health Outreach Fund (RHOF)12. The RHOF aims to improve the health outcomes of people living in regional, rural and remote Australia. The RHOF is provided by the Department of Health and administered at the state level by various organisations and outreach programs. The RHOF focuses on four main outreach health activities, which are (1) eye health, (2) maternal and paediatric health, (3) mental health and (4) chronic disease management.
Trachoma elimination in Australia
The Commonwealth Government is charged with implementing the SAFE strategy to eliminate trachoma from all remote Indigenous communities where it remains a significant eye health problem [184, 192]. The SAFE acronym stands for Surgery for trichiasis, Antibiotics, Facial cleanliness, Environmental improvement, and is a global initiative overseen by the World Health Organization (WHO). The SAFE strategy was recommended by WHO in its resolve to eliminate trachoma globally by 2020. Based on SAFE, the Communicable Diseases Network of Australia developed, the National Guidelines for the public health management of trachoma in Australia, which were updated in 2014 [18, 184].
The guidelines contain lengthy recommendations for the work of public health services and effectively constitute recommendations for trachoma management at family, community and jurisdictional levels and include the following aspects: community engagement, education for the health workforce, the SAFE strategy program evaluation and data collection.
While the guidelines reflect the SAFE strategy fully, there have been barriers to the systematic implementation of these guidelines in Australia [194], which include:
- lack of communication between key stakeholders
- lack of information resources which can be shared (although there have been more recent developments in this area, as outlined further in this section)
- lack of appropriate resourcing to meet policy objectives
- lack of redress of the underlying socioeconomic disadvantage, particularly environmental health factors which underpin the spread of trachoma
- low priority accorded to trachoma elimination within the overall Indigenous health policy
- low reliability of data due to variable quality of screening programs.
Community engagement in provision of treatment for trachoma is possibly the most important and relevant aspect which makes such treatment effective. Despite the barriers above, the prevalence of trachoma in Australia has dropped substantially. Through collaborative efforts between outreach eye services, vision research and previous government funding, rates of trachoma in children in outback communities have decreased from 21% to 3.8% between 2008 and 2017 [183].
Roadmap to close the gap for vision
The Roadmap to close the gap for vision was launched in 2012 by the Indigenous Eye Health Unit (IEHU) at the University of Melbourne [6]. It was created as a response to the results of the 2008 NIEHS, and has provided annual updates in various domains of activity since then. It comprises a policy framework for long term and sustainable changes to improve the quality of eye care services for Indigenous people. It has been used to make extensive recommendations to governments on improving eye health service provision and coordination, as well as advocating for ‘closing the gap’ in eye health between Aboriginal and Torres Strait Islander and other people.
In 2015, the IEHU collaborated with Price Waterhouse Coopers to estimate the economic impacts of eliminating preventable vision loss for Indigenous people [221]. This analysis demonstrated an estimated return of $1.60 for everyone $1 of funding for eye care, and a 10 year net economic benefit of $321 million, given adequate investment in implementation of the Roadmap.
Among other initiatives, the Roadmap has emphasised the need for culturally appropriate and accessible eye care services across all levels of the patient journey [222], the appointment of recognised positions, training and support for eye health workers, the integration of eye care with primary health care and Aboriginal health services [223], and the integration of chronic disease programs and diabetic eye care [224].
The Roadmap to close the gap has nine overarching recommendations:
- To include primary eye care as part of comprehensive primary health care
- To enhance access to eye health services for Indigenous people
- Improve coordination of eye care services and the referral pathway
- Increase the eye health workforce to meet the needs of the community
- To eliminate blinding trachoma from Australia
- Monitor and evaluation Indigenous eye health
- Ensure national delivery of the ‘Close the gap for vision’ through good governance
- Improve health promotion and awareness of eye health in the community
- Ensure adequate funding.
To date, the Roadmap has contributed to successful advocacy for the new MBS item for diabetic retinopathy screening, ongoing funding of outreach ophthalmology and optometry services, and the appointment of regional eye health coordinators in 37 of 51 targeted regions [225, 226].
Emerging role of telehealth in eye care
Telehealth13 is an emerging area within the eye health sector. As an adjunct to face-to-face clinical practice, telehealth has the potential to improve access to specialist care in areas with limited eye services [227]. The internet can be used for live videoconferencing between care providers and patients, and for ‘store-and-forward’ viewing of patient tests between one care provider and another. Mobile technologies, such as smartphones and tablet devices, can also provide accurate, low cost eye exams. There are a number of active projects which use teleophthalmology in Australia and overseas.
In WA, the Lions Outback Vision program has provided teleophthalmology services since 2011. A 12-month audit from 2015–2016 reported that 683 teleophthalmology consultations were performed, mostly (n=287, 42.7%) related to cataract, and almost all (98.6%) for patients from outer regional, remote or very remote WA [228]. This study did not report the proportion of patients who were Aboriginal or Torres Strait Islander. Prior to this, Lions Outback Vision demonstrated that most teleophthalmology referrals (59%) came from optometrists, with 37% of patients identifying as Indigenous [164]. Providing optometrists with logistical support, remuneration, a user-friendly referral pathway and awareness raising increased the number of telehealth referrals to an ophthalmologist by 3.5 fold [125]. Economic modelling showed a potential cost saving of $1.1 million/year through upscaling the use of teleophthalmology in WA [34]. Patients also reported a high level of satisfaction (69% ‘very satisfied’, 24.5 ‘satisfied’) with teleophthalmology consultations in WA [229].
With support from the CSIRO, another group from WA has developed ‘Remote-I’ for patients with diabetic eye disease. This is a store-and-forward telehealth system that consists of a photograph of the patient’s retina taken with a low-cost camera, uploaded over broadband internet and securely sent to an ophthalmologist for assessment [230]. The same group previously demonstrated that colour digital video recordings could be used for teleophthalmology screening of diabetic retinopathy [231], and that the 15-inch MacBook Pro and 9.7 inch iPad could reliably be used for still retinal images of diabetic eye disease [232].
A recent telehealth initiative is TEAMSnet (Telehealth Eye and Associated Medical Services Network), which is a collaborative program funded by the NH&MRC and coordinated by the Centre for Eye Research Australia. It aims to use retinal imaging, electronic lifestyle survey and clinical support tools, and mobile tablet technology to provide eye exams, and coordinated diabetes and heart care to Aboriginal and Torres Strait Islander people in the NT and Central Australia. Among 301 participants with Type 2 diabetes, TEAMSnet reported a gradable image rate of 78.7%, prevalences of 47% for any diabetic retinopathy, 14.4% for diabetic macular oedema (DMO) and 16.2% for sight-threatening retinopathy [166]. The efficacy of TEAMSnet will be evaluated by way of a pre-post intervention study, with patient adherence to clinical appointments as the primary outcome measure [233].
Other areas of telehealth which may hold promise for remote area and Indigenous eye health in Australia include Peek Vision and artificial intelligence technologies. Peek (Portable Eye Examination Kit) Vision is a medical technology social enterprise, which has developed and validated its products alongside a cohort study of eye disease in Kenya [234]. Peek technology consists of applications and adaptors for smartphones which allow portable, cost-effective eye examinations. To date, the Peek system has demonstrated accurate and repeatable acuity measurements [235], satisfaction and acceptability among patients and health care providers [236] and adequate acquisition of optic nerve images using smartphone retinal adaptors [237].
Novel artificial intelligence technologies can be used to detect and grade diabetic retinopathy on fundus photographs, using automated algorithms and deep learning. A recent study conducted in Australia used a deep learning algorithm for detection of diabetic retinopathy on fundus photographs, and demonstrated a sensitivity and specificity of 92.3% and 93.7%, respectively [238]. The majority of the 96 participants (78%) also reported a preference of the automated model over manual interpretation of images. Automated diabetic retinopathy detection on smartphone-based fundus photography was recently validated against grading by an ophthalmologist [239]. Prior to this, Google AI showed a high sensitivity and specificity for detecting referable diabetic retinopathy [240].
Concluding comments
There is a need for sustainable action to address the remaining gap in the eye health of Aboriginal and Torres Strait Islander people. Between 2008 and 2016, some measures of eye health, including the prevalence of blindness, spectacle coverage rate and cataract surgery rate, appear to have improved [2-5]. However, significant gaps remain across all measures when comparing eye health data between Indigenous and non-Indigenous people. Overall, the gap in the prevalence of vision loss has remained unchanged between 2008 and 2016, with Aboriginal and Torres Strait Islander people experiencing a three-fold higher rate of low vision at both time points [2, 3].
The capacity exists to provide the necessary services for a relatively modest increase in investment [20]. A constellation of organisations, programs and policies at the national, multi-state and jurisdictional levels seek to address these inequities. Key stakeholders at the national level include but are not limited to Vision 2020 Australia, the Royal Australian and New Zealand College of Ophthalmologists, Optometry Australia, the Visiting Optometry Scheme, National Trachoma Surveillance Unit, Fred Hollows Foundation, Brien Holden Vision Institute, CERA and the Indigenous Eye Health Unit at the University of Melbourne.
Advocacy from these and other groups has resulted in a number of new initiatives in recent years. These include the MBS item number for retinal screening, the appointment of regional eye health coordinators, ongoing funding for outreach eye services, a nationally consistent spectacle subsidy scheme and the Preserve Sight program for diabetic retinopathy.
A second NEHS is planned for late 2020–21 by Vision 2020 Australia and CERA, and promises to provide follow-up data on the eye health of Aboriginal and Torres Strait Islander people.
References
- Hopkins, S., Sampson, G. P., Hendicott, P., & Wood, J. M. (2016). A visual profile of Queensland Indigenous children. Optometry and Vision Science, Published Ahead of Print(http://dx.doi.org/10.1097/OPX.0000000000000797).
- Foreman, J., Xie, J., Keel, S., van Wijngaarden, P., Sandhu, S. S., Ang, G. S., Dirani, M. (2017). The prevalence and causes of vision loss in Indigenous and non-Indigenous Australians: The National Eye Health Survey. Ophthalmology, 124(12), 1743-1752.
- Taylor, H. R., Xie, J., Fox, S., Dunn, R. A., Arnold, A.-L., & Keeffe, J. E. (2010). The prevalence and causes of vision loss in Indigenous Australians: the National Indigenous Eye Health Survey. Medical Journal of Australia, 192(6), 312-318.
- Foreman, J., Xie, J., Keel, S., Taylor, H. R., & Dirani, M. (2017). Treatment coverage rates for refractive error in the National Eye Health survey. PLOS ONE, 12(4), 1-12.
- Australian Institute of Health and Welfare. (2018). Indigenous eye health measures 2017. Retrieved 26 April 2018 from https://www.aihw.gov.au/reports/indigenous-australians/indigenous-eye-health-measures-2017/contents/summary
- Taylor, H. R., Anjou, M. D., Boudville, A. I., & McNeil, R. J. (2012). The roadmap to close the gap for vision: full report. Melbourne: Indigenous Eye Health Unit, the University of Melbourne.
- Vision 2020 Australia. (2018). New investment in spectacles for Aboriginal and Torres Strait Islander people. Retrieved 3 August 2018 from http://www.vision2020australia.org.au/media/2018-08-03/new-investment-in-spectacles-for-aboriginal-and-torres-strait-islander-people
- Foreman, J., Xie, J., Keel, S., van Wijngaarden, P., Crowston, J., Taylor, H. R., & Dirani, M. (2017). Cataract surgery coverage rates for Indigenous and non-Indigenous Australians: the National Eye Health Survey. Medical Journal of Australia, 207(6), 256-261.
- Boudville, A. I., Anjou, M. D., & Taylor, H. R. (2013). Indigenous access to cataract surgery: an assessment of the barriers and solutions within the Australian health system. Clinical & Experimental Ophthalmology, 41(2), 148–154.
- Hsueh, Y. S., Dunt, D., Anjou, M. D., Boudville, A., & Taylor, H. (2013). Close the gap for vision: the key is to invest on coordination. Australian Journal of Rural Health, 21(6), 299-305.
- Keel, S., Xie, J., Foreman, J., van Wijngaarden, P., Taylor, H., ,, & Dirani, M. (2017). The prevalence of diabetic retinopathy in Australian adults with self-reported diabetes: The National Eye Health Survey. Ophthalmology, 124(7), 977-984.
- McCarty, C. A. (2003). Diabetic retinopathy: yet another reason for a comprehensive eye-care programme for Australian Aborigines and Torres Strait Islanders [editorial]. Clinical & Experimental Ophthalmology, 31(1), 6-7.
- Indigenous Eye Health Unit. (2015). Check Today, See Tomorrow. Melbourne: Indigenous Eye Health Unit, University of Melbourne.
- Mitchell, P., Foran, S., Wong, T. Y., Chua, B., Patel, I., & Ojaimi, E. (2008). Guidelines for the management of diabetic retinopathy. Canberra: National Health and Medical Research Council.
- Dirani, M., Shaw, J., & Crowston, J. (2013). Out of sight: diabetic eye disease in Australia. Melbourne: Baker IDI Heart and Diabetes Institute Centre for Eye Research Australia.
- Tellis, B., Fotis, K., Dunn, R., Keeffe, J., & Taylor, H. (2009). Trachoma surveillance report 2008. Melbourne, Vic: National Trachoma Surveillance and Reporting Unit, Centre for Eye Research Australia.
- The Kirby Institute. (2018). Australian trachoma surveillance report 2017. Sydney: The Kirby Institute, University of New South Wales.
- Communicable Disease Network Australia. (2014). Trachoma: CDNA national guidelines for the public health management of trachoma. Canberra: Australian Department of Health.
- Australian Bureau of Statistics. (2013). Australian Aboriginal and Torres Strait Islander health survey: first results, Australia, 2012-13. Canberra: Australian Bureau of Statistics.
- Hsueh, Y. S., Brando, A., Dunt, D., Anjou, M. D., Boudville, A., & Taylor, H. (2013). Cost of close the gap for vision of Indigenous Australians: on estimating the extra resources required. Australian Journal of Rural Health, 21(6), 329-335.
- Estevez, J., Kaidonis, G., Henderson, T., Craig, J. E., & Landers, J. (2017). Association of disease-specific causes of visual impairment and 10-year mortality among Indigenous Australians: the Central Australian Ocular Health Study. Clinical & Experimental Ophthalmology, Accepted Articles(http://dx.doi.org/10.1111/ceo.13009), 1-17.
- Ng, S. K., Kahawita, S., Andrew, N. H., Henderson, T., Craig, J. E., & Landers, J. (2018). Association of visual impairment and all-cause 10-year mortality among Indigenous Australian individuals within central Australia: The Central Australian Ocular Health Study. JAMA Ophthalmology, Online first(http://dx.doi.org/10.1001/jamaophthalmol.2017.6787).
- Taylor, H. R., & National Indigenous Eye Health Survey Team. (2009). National Indigenous eye health survey: minum barreng (tracking eyes): summary report. Melbourne: Indigenous Eye Health Unit, The University of Melbourne.
- Access Economics. (2010). Clear focus: the economic impact of vision loss in Australia in 2009. Melbourne: Vision 2020 Australia.
- Australian Institute of Health and Welfare. (2017). Aboriginal and Torres Strait Islander Health Performance Framework. Retrieved 30 May 2017 from https://www.aihw.gov.au/reports/indigenous-health-welfare/health-performance-framework/contents/summary
- Australian Department of Health and Ageing, & Victorian Department of Human Services. (2005). Eye health in Australia: a background paper to the national framework for action to promote eye health and prevent avoidable blindness and vision loss. Canberra: Australian Government Department of Health and Ageing.
- Pascolini, D., & Mariotti, S. P. (2012). Global estimates of visual impairment: 2010. British Journal of Ophthalmology, 96(5), 614-618.
- Turner, A. W., Xie, J., Arnold, A.-L., & Taylor, H. R. (2011). Eye health service access and utilization in the National Indigenous Eye Health Survey. Clinical & Experimental Ophthalmology, 39(7), 598-603.
- Turner, A. W., Mulholland, W. J., & Taylor, H. R. (2011). Coordination of outreach eye services in remote Australia. Clinical & Experimental Ophthalmology, 39(4), 344–349.
- Anjou, M. D., Boudville. A.I., & Taylor, H. R. (2013). Correcting Indigenous Australians’ refractive error and presbyopia. Clinical & Experimental Ophthalmology, 41(4), 320–328.
- Taylor, H. R., Boudville, A. I., & Anjou, M. D. (2012). The roadmap to close the gap for vision. Medical Journal of Australia, 197(11), 613-615.
- Copeland, S., Muir, J., & Turner, A. (2017). Understanding Indigenous patient attendance: a qualitative study. Australian Journal of Rural Health, Early view(https://doi.org/10.1111/ajr.12348).
- Turner, A., Mulholland, W., & Taylor, H. R. (2009). Outreach eye services in Australia. Melbourne: Indigenous Eye Health Unit.
- Razavi, H., Copeland, S. P., & Turner, A. W. (2017). Increasing the impact of teleophthalmology in Australia: analysis of structural and economic drivers in a state service. Australian Journal of Rural Health, 25(1), 45-52.
- World Health Organization. (2013). Universal eye health: a global action plan 2014-2019. Geneva: World Health Organization.
- Saggers, S., & Gray, D. (1991). Aboriginal health and society: the traditional and contemporary Aboriginal struggle for better health. North Sydney: Allen and Unwin.
- Carson, B., Dunbar, T., Chenhall, R. D., & Bailie, R. (Eds.). (2007). Social determinants of Indigenous health. Crows Nest, NSW: Allen and Unwin.
- Close the Gap Steering Committee. (2012). Submission to the National Aboriginal and Torres Strait Islander Health Plan: Close the Gap campaign Steering Committee.
- Kamien, M. (1980). The Aboriginal Australian experience. In N. F. Stanley & R. A. Joske (Eds.), Changing disease patterns and human behaviour (pp. 254-270). London: Academic Press.
- Altman, J. (2003). The economic and social context of Indigenous health. In N. Thomson (Ed.), The health of Indigenous Australians (pp. 25-43). South Melbourne: Oxford University Press.
- Thomson, N. (Ed.). (2003). The health of Indigenous Australians. South Melbourne: Oxford University Press.
- Moodie, P. M. (1981). Australian Aborigines. In H. C. Trowell & D. P. Burkitt (Eds.), Western diseases, their emergence and prevention (pp. 154-167). London, U.K.: Edward Arnold.
- Marmot, M. (2004). The status syndrome: how social standing affects our health and longevity. New York: Holt Paperbacks.
- Wilkinson, R., & Marmot, M. (2003). Social determinants of health: the solid facts. Denmark: World Health Organization.
- Steering Committee for the Review of Government Service Provision. (2016). Overcoming Indigenous disadvantage: key indicators 2016 report. Canberra: Productivity Commission.
- Australian Institute of Health and Welfare. (2011). Chronic kidney disease in Aboriginal and Torres Strait Islander people 2011. Canberra: Australian Institute of Health and Welfare.
- Steering Committee for the Review of Government Service Provision. (2011). Report on government services 2011: Indigenous compendium. Canberra: Productivity Commission.
- Hoy, W. E., Kincaid-Smith, P., Hughson, M. D., Fogo, A., Sinniah, R., Dowling, J., Bertram, J. F. (2010). CKD in Aboriginal Australians. American Journal of Kidney Diseases, 56(5), 983–993.
- Li, Z., McNally, L., Hilder, L., & Sullivan, E. A. (2011). Australia’s mothers and babies 2009. Canberra: Australian Institute of Health and Welfare.
- Jaggernath, J., Øverland, L., Ramson, P., Kovai, V., Chan, V. F., & Naidoo, K. S. (2014). Poverty and eye health. Health, 6(14), 1849-1860.
- Hoy, W. (1998). Renal disease as a metaphor: towards a more integrated view of Aboriginal health. Clinical and Experimental Pharmacology and Physiology, 25(12), 1038-1042.
- Spencer, J. L., Silva, D. T., Snelling, P., & Hoy, W. E. (1998). An epidemic of renal failure among Australian Aboriginals. Medical Journal of Australia, 168(11), 537-541.
- Thomas, M. A. B. (1998). Kidney disease in Australian Aboriginals: time for decisive action [editorial]. Medical Journal of Australia, 168(11), 532-533.
- Thornton, J., Edwards, R., Mitchell, P., Harrison, R. A., Buchan, I., & Kelly, S. P. (2005). Smoking and age-related macular degeneration: a review of association. Eye, 19(9), 935–944.
- Cass, A., Cunningham, J., Snelling, P., Wang, Z., & Hoy, W. (2004). Exploring the pathways leading from disadvantage to end-stage renal disease for Indigenous Australians. Social Science & Medicine, 58(4), 767-785.
- Australian Bureau of Statistics. (2006). National Aboriginal and Torres Strait Islander Health Survey: Australia, 2004-05. Canberra: Australian Bureau of Statistics.
- Australian Bureau of Statistics, & Australian Institute of Health and Welfare. (2008). The health and welfare of Australia’s Aboriginal and Torres Strait Islander Peoples 2008. Canberra: Australian Bureau of Statistics and Australian Institute of Health and Welfare.
- Australia and New Zealand Dialysis and Transplant Registry. (2010). The thirty third report: Australia and New Zealand Dialysis and Transplant Registry: 2010. Adelaide: Australia and New Zealand Dialysis and Transplant Registry.
- Australian Institute of Health and Welfare. (2010). Chronic kidney disease hospitalisations in Australia 2000–01 to 2007–08. Canberra: Australian Institute of Health and Welfare.
- Luke, J. N., Ritte, R., O’Dea, K., Brown, A., Piers, L. S., Jenkins, A. J., & Rowley, K. G. (2015). Nutritional predictors of successful chronic disease prevention for a community cohort in Central Australia. Public Health Nutrition, FirstView(http://dx.doi.org/10.1017/S1368980015003262).
- McNamara, B. J., Gubhaju, L., Chamberlain, C., Stanley, F., & Eades, S. J. (2012). Early life influences on cardio-metabolic disease risk in aboriginal populations – what is the evidence? A systematic review of longitudinal and case–control studies. International Journal of Epidemiology, 41(6), 1661-1682.
- Konstantinidis, L., & Guex-Crosier, Y. (2016). Hypertension and the eye. Current Opinion in Ophthalmology, 27(6), 514-521.
- Xie, J., Ikram, M. K., Cotch, M. F., Klein, B., Varma, R., Shaw, J. E., Wong, T. Y. (2017). Association of diabetic macular edema and proliferative diabetic retinopathy with cardiovascular disease: a systematic review and meta-analysis. JAMA Ophthalmology, 135(6), 586-593.
- Vos, T., & Taylor, H. R. (2013). Contribution of vision loss to the Indigenous health gap. Clinical & Experimental Ophthalmology, 41(3), 309–310.
- Australian Institute of Health and Welfare. (2016). Australian Burden of Disease Study: impact and causes of illness and death in Aboriginal and Torres Strait Islander people 2011. Canberra: Australian Institute of Health and Welfare.
- Begg, S., Vos, T., Barker, B., Stevenson, C., Stanley, L., & Lopez, A. (2007). The burden of disease and injury in Aboriginal and Torres Strait Islander peoples 2003. Brisbane: Centre for Burden of Disease and Cost-Effectiveness, School of Population Health, University of Queensland.
- Landers, J., Henderson, T., & Craig, J. (2010). The prevalence and causes of visual impairment in Indigenous Australians within central Australia: the Central Australian Ocular Health Study. British Journal of Ophthalmology, 94(9), 1140-1144.
- Foreman, J., Keel, S., Dunn, R., van Wijngaarden, P., Taylor, H. R., & Dirani, M. (2017). Sampling methodology and site selection in the National Eye Health Survey (NEHS): an Australian population-based prevalence study. Clinical & Experimental Ophthalmology, 45(4), 336-347.
- Landers, J., Henderson, T., & Craig, J. E. (2012). Incidence of visual impairment and blindness in Indigenous Australians within Central Australia: the Central Australian Ocular Health Study. Clinical & Experimental Ophthalmology, 40(7), 657–661.
- Landers, J., Henderson, T., & Craig, J. E. (2013). Incidence of visual impairment due to cataract, diabetic retinopathy and trachoma in Indigenous Australians within Central Australia: the Central Australian Ocular Health Study. Clinical & Experimental Ophthalmology, 41(1), 50–55.
- Taylor, H. R., & National Indigenous Eye Health Survey Team. (2009). National Indigenous eye health survey: minum barreng (tracking eyes): full report. Melbourne: Indigenous Eye Health Unit, The University of Melbourne.
- Australian Bureau of Statistics. (2013). Australian Aboriginal and Torres Strait Islander health survey: first results, Australia, 2012-13: Table 3 [data cube]. Retrieved 27 November 2013 from http://www.abs.gov.au/AUSSTATS/subscriber.nsf/log?openagent&table%203%20selected%20health%20characteristics,%20by%20state_territory%202012-13-australia.xls&4727.0.55.001&Data%20Cubes&D43DB1D697BED77ECA257C2F00145D04&0&2012-13&27.11.2013&Latest
- Australian Bureau of Statistics. (2013). Australian Aboriginal and Torres Strait Islander health survey: first results, Australia, 2012-13: Table 5 [data cube]. Retrieved 27 November 2013 from http://www.abs.gov.au/AUSSTATS/subscriber.nsf/log?openagent&table%205%20long-term%20conditions%20by%20sex%20by%20indigenous%20status,%202012-13%20-%20australia.xls&4727.0.55.001&Data%20Cubes&5C97CE7DA7059C06CA257C2F00145D5A&0&2012-13&27.11.2013&Latest
- Australian Bureau of Statistics. (2014). Australian Aboriginal and Torres Strait Islander health survey: first results, Australia, 2012-13: Table 6 [data cube]. Retrieved 26 March 2014 from http://www.abs.gov.au/AUSSTATS/subscriber.nsf/log?openagent&table%206%20long-term%20conditions%20by%20age%20by%20indigenous%20status,%202012-13%20-%20australia.xls&4727.0.55.001&Data%20Cubes&A9CAFB0F3F64E992CA257CA6000E32B3&0&2012-13&26.03.2014&Latest
- Australian Bureau of Statistics. (2014). Australian Aboriginal and Torres Strait Islander health survey: first results, Australia, 2012-13: Table 2 [data cube]. Retrieved 26 March 2014 from http://www.abs.gov.au/AUSSTATS/subscriber.nsf/log?openagent&table%202%20selected%20health%20characteristics,%20by%20remoteness%20area%202012-13%20-%20australia.xls&4727.0.55.001&Data%20Cubes&9F3D9B7052520B1BCA257CA6000E31B5&0&2012-13&26.03.2014&Latest
- Foreman, J., Xie, J., Keel, S., Ang, G. S., Lee, P. Y., Bourne, R., Dirani, M. (2018). Prevalence and causes of unilateral vision impairment and unilateral blindness in Australia: the National Eye Health Survey. JAMA Ophthalmology, Online first(https://doi.org/10.1001/jamaophthalmol.2017.6457).
- Australian Institute of Health and Welfare. (2017). Indigenous eye health measures 2016. Canberra: Australian Institute of Health and Welfare.
- Burgess, K., Gilbert, M., McIntyre, J., & Mole, T. (2018). Admitted patient care 2016-17: Australian hospital statistics. Canberra: Australian Institute of Health and Welfare.
- Centre for Eye Research Australia. (2008). Refractive error (pp. 1). Melbourne: Centre for Eye Research Australia.
- Biotext. (2008). Risk factors for eye disease and injury: literature review. Canberra: National Health and Medical Research Council, Australia.
- Kempen, J. H., Mitchell, P., Lee, K. E., Tielsch, J. M., Broman, A. T., Taylor, H. R., & Eye Diseases Prevalence Research Group. (2004). The prevalence of refractive errors among adults in the United States,Western Europe, and Australia. Archives of Ophthalmology, 122(4), 495-505.
- Resnikoff, S., Pascolini, D., Mariotti, S. P., & Pokharel, G. P. (2008). Global magnitude of visual impairment caused by uncorrected refractive errors in 2004. Bulletin of the World Health Organization, 86(1), 63-70.
- Flitcroft, D. I. (2014). Emmetropisation and the aetiology of refractive errors. Eye, 2014(28), 169-179.
- Xiong, S., Sankaridurg, P., Naduvilath, T., Zang, J., Zou, H., Zhu, J., Xu, X. (2017). Time spent in outdoor activities in relation to myopia prevention and control: a meta‐analysis and systematic review. Acta Ophthalmologica, 95(6), 551-566.
- Bourne, R. R. A., Stevens, G. A., White, R. A., Smith, J. L., Flaxman, S. R., Price, H., Taylor, H. R. (2013). Causes of vision loss worldwide, 1990-2010: a systematic analysis. The Lancet Global Health, 1(6), e339-e349.
- Taylor, H. R. (1981). Racial variations in vision. American Journal of Epidemiology, 113(1), 62-80.
- Keel, S., Foreman, J., Xie, J., Taylor, H. R., & Dirani, M. (2018). Prevalence and associations of presenting near-vision impairment in the Australian National Eye Health Survey. Eye, Early view(https://doi.org/10.1038/eye.2017.317).
- Arnold, A.-L. M. R., Goujon, N., Busija, L., Fox, S., Xie, J., Dunn, R. A., Taylor, H. R. (2013). Near-vision impairment and unresolved vision problems in Indigenous Australian adults. Clinical & Experimental Ophthalmology, 41(3), 223–230.
- Taylor, H. R., Livingston, P. M., Stanislavsky, Y. L., & McCarty, C. A. (1997). Visual impairment in Australia: distance visual acuity, near vision, and visual field findings of the Melbourne Visual Impairment Project. American Journal of Ophthalmology, 123(3), 328-337.
- Landers, J., & Henderson, T. (2013). High levels of uncorrected presbyopia among Indigenous Australians: a concern and an opportunity. Clinical & Experimental Ophthalmology, 41(3), 219-220.
- Landers, J., Henderson, T., & Craig, J. (2010). Prevalence and associations of refractive error in Indigenous Australians within central Australia: the Central Australian Ocular Health Study. Clinical & Experimental Ophthalmology, 38(4), 381–386.
- Robaei, D., Huynh, S. C., Kifley, A., & Mitchell, P. (2006). Correctable and non-correctable visual impairment in a population-based sample of 12-year-old Australian children. American Journal of Ophthalmology, 142(1), 112-118.
- Robaei, D., Kifley, A., Rose, K. A., & Mitchell, P. (2006). Refractive error and patterns of spectacle use in 12-year-old Australian children. Ophthalmology, 113(9), 1567-1573.
- Wright, H. R., Keeffe, J. E., & Taylor, H. R. (2009). Trachoma, cataracts and uncorrected refractive error are still important contributors to visual morbidity in two remote Indigenous communities of the Northern Territory, Australia. Clinical & Experimental Ophthalmology, 37(6), 550-557.
- Australian Department of Health and Ageing. (2011). Australian Government directory of services for older people 2011. Canberra: Australian Department of Health and Ageing.
- Morse, A., Cappuccio, S., Tahhan, N., Burnett, A., Ryan, S., & Kiely, P. (2013, 7-10 April 2013). What’s fair in vision care? Potential approaches for equitable access to spectacles. Paper presented at the 12th National Rural Health Conference, Adelaide.
- Abouzeid, M., Anjou, M. D., & Taylor, H. R. (2015). Equity in vision in Australia is in sight. Medical Journal of Australia, 203(1), 21-23.
- Napper, G., Fricke, T., Anjou, M. D., & Jackson, A. J. (2015). Breaking down barriers to eye care for Indigenous people: a new scheme for delivery of eye care in Victoria. Clinical and Experimental Optometry, 98(5), 430-434.
- Australian Department of Health. (2014). Implementation plan under the National framework for action to promote eye health and prevent avoidable blindness and vision loss. Canberra: Australian Department of Health.
- Lee, C. M., & Afshari, N. A. (2017). The global state of cataract blindness. Current Opinion in Ophthalmology, 28(1), 98-103.
- Klein, B. E. K., Klein, R., & Lee, K. E. (1998). Diabetes, cardiovascular disease, selected cardiovascular disease risk factors, and the 5-year incidence of age-related cataract and progression of lens opacities: the Beaver Dam Eye Study. American Journal of Ophthalmology, 126(6), 782-790.
- Sheeladevi, S., Lawrenson, J. G., Fielder, A. R., & Suttle, C. M. (2016). Global prevalence of childhood cataract: a systematic review. Eye, 30, 1160-1169.
- Lewis, A., Congdon, N., Munoz, B., Bowie, H., Lai, H., Chen, P., & West, S. K. (2004). Cataract surgery and subtype in a defined, older population: the SEECAT Project. British Journal of Ophthalmology, 88(12), 1512-1517.
- Taylor, H. R., Xie, J., Arnold, A. L., Goujon, N., Dunn, R. A., Fox, S., & Keeffe, J. (2010). Cataract in Indigenous Australians: the National Indigenous Eye Health Survey. Clinical & Experimental Ophthalmology, 38(8), 790–795.
- Landers, J., Henderson, T., & Craig, J. (2010). Prevalence and associations of cataract in Indigenous Australians within central Australia: the Central Australian Ocular Health Study. Clinical & Experimental Ophthalmology, 38(4), 387-392.
- Australian Health Ministers’ Advisory Council. (2017). Aboriginal and Torres Strait Islander Health Performance Framework 2017 report. Canberra: Department of the Prime Minster and Cabinet.
- Kelaher, M., Ferdinand, A., & Taylor, H. (2012). Access to eye health services among Indigenous Australians: an area level analysis. BMC Ophthalmology, 12. Retrieved from: http://dx.doi.org/10.1186/1471-2415-12-51
- Randall, D. A., Reinten, T., Maher, L., Lujic, S., Stewart, J., Keay, L., Jorm, L. R. (2014). Disparities in cataract surgery between Aboriginal and non-Aboriginal people in New South Wales, Australia. Clinical & Experimental Ophthalmology, 42(7), 629-636.
- Australian Institute of Health and Welfare. (2016). Admitted patient care 2014-15: Australian hospital statistics. Canberra: Australian Institute of Health and Welfare.
- Australian Institute of Health and Welfare. (2015). Aboriginal and Torres Strait Islander health performance framework 2014 report: detailed analyses. Canberra: Australian Institute of Health and Welfare.
- Goujon, N., Brown, C. M., Xie, J., Arnold, A.-L., Dunn, R. A., Keeffe, J. E., & Taylor, H. R. (2010). Self-reported vision and health of Indigenous Australians. Clinical & Experimental Ophthalmology, 38(8), 796-804.
- Foreman, J., Xie, J., Keel, S., Taylor, H. R., & Dirani, M. (2018). Utilisation of eye health care services in Australia: the National Eye Health Survey. Clinical & Experimental Ophthalmology, 46(3), 213-221.
- Lindfield, R. (2014). Improving the quality of cataract surgery. Community Eye Health, 28(85), 9-11.
- Hansen, M. S., & Hardten, D. R. (2015). Financially efficient cataract surgery in today’s healthcare environment. Current Opinion in Ophthalmology, 26(1), 61-65.
- Taylor, H. R., Henderson, T. R. M., & Le Mesurier, R. T. (2015). Cataract surgical blitzes: an Australian anachronism. Medical Journal of Australia, 202(8), 407-408.
- Anjou, M. D., Boudvile, A. I., & Taylor, H. R. (2012). We can see the gap: regional eye health coordination for Indigenous Australians. Aboriginal and Islander Health Worker Journal, 36(2), 12-16.
- Keel, S., Xie, J., Foreman, J., Taylor, H. R., & Dirani, M. (2018). Population-based assessment of visual acuity outcomes following cataract surgery in Australia: the National Eye Health Survey. British Journal of Ophthalmology, Online first(https://doi.org/10.1136/bjophthalmol-2017-311257).
- Taylor, H. R. (1997). Eye health in Aboriginal and Torres Strait Islander communities. Canberra: Commonwealth Department of Health and Family Services.
- Hewitt, A., Verman, N., & Gruen, R. (2001). Visual outcomes for remote Australian Aboriginal people after cataract surgery. Clinical & Experimental Ophthalmology, 29(2), 68-74.
- New South Wales Centre for Epidemiology and Evidence. (2012). The health of Aboriginal people of NSW: report of the Chief Health Officer 2012. Sydney: New South Wales Ministry of Health.
- Wearne, S. M. (2007). Remote Indigenous Australians with cataracts: they are blind and still can’t see [viewpoint]. Medical Journal of Australia, 187(6), 353-356.
- Penrose, L., Roe, Y., Johnson, N. A., & James, E. L. (2018). Process redesign of a surgical pathway improves access to cataract surgery for Aboriginal and Torres Strait Islander people in South East Queensland. Australian Journal of Primary Health, Online Early(https://doi.org/10.1071/PY17039), 1-6.
- Turner, A. W., Mulholland, W., & Taylor, H. R. (2011). Funding models for outreach ophthalmology services. Clinical & Experimental Ophthalmology, 39(4), 350-357.
- Tapp, R. J., Anjou, M. D., Boudville, A. I., & Taylor, H. R. (2013). The roadmap to close the gap for vision – diabetes-related eye care in the Indigenous Australian population [letter]. Diabetic Medicine, 30(9), 1145–1146.
- O’Day, R., Smith, C., Muir, J., & Turner, A. (2016). Optometric use of a teleophthalmology service in rural Western Australia: comparison of two prospective audits. Clinical and Experimental Optometry, 99(2), 163-167.
- Yau, J. W. Y., Rogers, S. L., Kawasaki, R., Lamoureux, E. L., Kowalski, J. W., Bek, T., Wong, T. Y. (2012). Global prevalence and major risk factors of diabetic retinopathy. Diabetes Care, 35(3), 556-564.
- International Diabetes Federation, & Fred Hollows Foundation. (2015). Diabetes eye health: a guide for health care professionals. Brussels, Belgium: International Diabetes Federation.
- Dirani, M., McAuley, A. K., Maple-Brown, L., Kawasaki, R., McIntosh, R. L., Harper, C. A., Cunningham, J. (2010). Association of retinal vessel calibre with diabetic retinopathy in an urban Australian Indigenous population. Clinical & Experimental Ophthalmology, 38(6), 577-582.
- Keel, S., Foreman, J., Xie, J., van Wijngaarden, P., Taylor, H. R., & Dirani, M. (2017). The prevalence of self-reported diabetes in the Australian National Eye Health Survey. PLOS ONE, 12(1). Retrieved from: http://dx.doi.org/10.1371/journal.pone.0169211
- Australian Institute of Health and Welfare. (2015). Cardiovascular disease, diabetes and chronic kidney disease – Australian facts: Aboriginal and Torres Strait Islander people. Canberra: Australian Institute of Health and Welfare.
- Office for Aboriginal and Torres Strait Islander Health. (2001). Specialist eye health guidelines for use in Aboriginal and Torres Strait Islander populations. Canberra: Commonwealth Department of Health and Aged Care.
- Kaidonis, G., Mills, R. A., Landers, J., Lake, S. R., Burdon, K. P., & Craig, J. E. (2014). Review of the prevalence of diabetic retinopathy in Indigenous Australians. Clinical & Experimental Ophthalmology, 42(9), 875–882.
- Grams, J., & Garvey, W. T. (2015). Weight loss and the prevention and treatment of type 2 diabetes using lifestyle therapy, pharmacotherapy, and bariatric surgery: mechanisms of action. Current Obesity Reports, 4(2), 287-302.
- Xie, J., Arnold, A., Keeffe, J., Goujon, N., Dunn, R. A., Fox, S., & Taylor, H. R. (2011). Prevalence of self-reported diabetes and diabetic retinopathy in indigenous Australians: the National Indigenous Eye Health Survey. Clinical & Experimental Ophthalmology, 39(6), 487-493.
- Jaross, N., Ryan, P., & Newland, H. (2003). Prevalence of diabetic retinopathy in an Aboriginal Australian population: results from the Katherine Region Diabetic Retinopathy Study (KRDRS): report no. 1. Clinical & Experimental Ophthalmology, 31(1), 32-39.
- Spurling, G. K. P., Askew, D. A., Hayman, N. E., Hansar, N., Cooney, A. M., & Jackson, C. L. (2010). Retinal photography for diabetic retinopathy screening in Indigenous primary health care: the Inala experience. Australian and New Zealand Journal of Public Health, 34(s1), S30-S33.
- Durkin, S. R., Casson, R., Newland, H. S., & Selva, D. (2006). Prevalence of trachoma and diabetes-related eye disease among a cohort of adult Aboriginal patients screened over the period 1999-2004 in remote South Australia. Clinical & Experimental Ophthalmology, 34(4), 329-334.
- Clark, A., Morgan, W. H., Kain, S., Farah, H., Armstrong, K., Preen, D., Yu, D.-Y. (2010). Diabetic retinopathy and the major causes of vision loss in Aboriginals from remote Western Australia. Clinical & Experimental Ophthalmology, 38(5), 475-482.
- Davis, T. M., McAullay, D., Davis, W. A., & Bruce, D. G. (2007). Characteristics and outcome of type 2 diabetes in urban Aboriginal people: the Fremantle Diabetes Study. Internal Medicine Journal, 37(1), 59-63.
- Landers, J., Henderson, T., Abhary, S., & Craig, J. (2010). Prevalence and associations of diabetic retinopathy in Indigenous Australians within central Australia: the Central Australian Ocular Health Study. Clinical & Experimental Ophthalmology, 38(4), 393-397.
- International Council of Ophthalmology. (2017). ICO guidelines for diabetic eye care. San Francisco: International Council of Ophthalmology.
- Murray, R. B., Metcalf, S. M., Lewis, P. M., Mein, J. K., & McAllister, I. L. (2005). Sustaining remote-area programs: retinal camera use by Aboriginal health workers and nurses in a Kimberley partnership. Medical Journal of Australia, 182(10), 520-523.
- Minges, K. E., Zimmet, P., Magliano, D. J., Dunstan, D. W., Brown, A., & Shaw, J. E. (2011). Diabetes prevalence and determinants in Indigenous Australian populations: a systematic review. Diabetes Research and Clinical Practice, 93(2), 139-149.
- Askew, D. A., Togni, S. J., Schluter, P. J., Rogers, L., Egert, S., Potter, N., Brown, A. D. (2016). Investigating the feasibility, acceptability and appropriateness of outreach case management in an urban Aboriginal and Torres Strait Islander primary health care service: a mixed methods exploratory study. BMC Health Services Research, 16. Retrieved from: http://dx.doi.org/10.1186/s12913-016-1428-0
- Moynihan, V., & Turner, A. (2017). Coordination of diabetic retinopathy screening in the Kimberley region of Western Australia. Australian Journal of Rural Health, 25(2), 110-115.
- Indigenous Eye Health Unit. (2015). 2015 annual update on the implementation of the roadmap to close the gap for vision. Melbourne: Indigenous Eye Health Unit, the University of Melbourne.
- Meyer, J., Johnson, K., Bowyer, J., Muir, J., & Turner, A. (2016). Evaluating a health video on diabetic retinopathy. Health Promotion Journal of Australia, 27(1), 84-87.
- Tapp, R. J., Svoboda, J., Fredericks, B., Jackson, A. J., & Taylor, H. R. (2015). Retinal photography screening programs to prevent vision loss from diabetic retinopathy in rural and urban Australia: a review. Ophthalmic Epidemiology, 22(1), 52-59.
- Mak, D., Plant, A., & McAllister, I. (2003). Screening for diabetic retinopathy in remote Australia: a program description and evaluation of a devolved model. Australian Journal of Rural Health, 11(5), 224-230.
- Glasson, N. M., Crossland, L. J., & Larkins, S. L. (2016). An innovative Australian outreach model of diabetic retinopathy screening in remote communities. Journal of Diabetes Research. Retrieved from: http://dx.doi.org/10.1155/2016/1267215
- Larizza, M. F., Hodgson, L. A., Fenwick, E. K., Kawasaki, R., Audehm, R., Wang, J. J., Lamoureux, E. L. (2013). Feasibility of screening for diabetic retinopathy at an Australian pathology collection service: a pilot study. Medical Journal of Australia, 198(2), 97-99.
- Australian Government Department of Human Services. (2016). Medicare Benefits Schedule – listing of photography with non-mydriatic retinal cameras – Budget 2016-17. Retrieved 1 November 2016 from https://www.humanservices.gov.au/organisations/about-us/budget/budget-2016-17/health-matters-and-health-professionals/medicare-benefits-schedule-listing-photography-non-mydriatic
- Australian Government Department of Health. (2016). Medicare Benefits Schedule – listing of photography with non-mydriatic retinal cameras. Retrieved 3 May 2016 from http://www.immunise.health.gov.au/internet/budget/publishing.nsf/Content/budget2016-factsheet07.htm
- Tapp, R. J., Boudville, A., Abouzeid, M., Anjou, M. D., & Taylor, H. R. (2015). Impact of diabetes on eye care service needs: the National Indigenous Eye Health Survey. Clinical & Experimental Ophthalmology, 43(6), 540-543.
- Foreman, J., Keel, S., Xie, J., Van Wijngaarden, P., Taylor, H. R., & Dirani, M. (2017). Adherence to diabetic eye examination guidelines in Australia: the National Eye Health Survey. Medical Journal of Australia, 206(9), 402-406.
- Virgili, G., Parravano, M., Evans, J. R., Gordon, I., & Lucenteforte, E. (2017). Anti-vascular endothelial growth factor for diabetic macular oedema: a network meta-analysis. Cochrane Database of Systematic Reviews, (6). Retrieved from: https://doi.org/10.1002/14651858.CD007419.pub5
- Writing Committee for the Diabetic Retinopathy Clinical Research Network. (2015). Panretinal photocoagulation vs intravitreous ranibizumab for proliferative diabetic retinopathy: A randomized clinical trial. JAMA, 314(20), 2137-2146.
- Haller, J. A. (2013). Current anti-vascular endothelial growth factor dosing regimens. Ophthalmology, 120(5 Suppl), S3-S7.
- Amoaku, W. M., Saker, S., & Stewart, E. A. (2015). A review of therapies for diabetic macular oedema and rationale for combination therapy. Eye, 29(9), 1115-1130.
- Turner, A. W., & House, P. H. (2011). The rising tide of diabetic retinopathy in Indigenous Australians [editorial]. Clinical & Experimental Ophthalmology, 39(6), 483-484.
- Tapp, R. J., Shaw, J. E., Harper, C. A., de Courten, M. P., Balkau, B., McCarty, D. J., Zimmet, P. Z. (2003). The prevalence of and factors associated with diabetic retinopathy in the Australian population. Diabetes Care, 26(6), 1731-1737.
- Northern Territory Government. (2018). Northern Territory water regulatory reform: directions paper. Darwin: Northern Territory Government.
- Magliano, D. J., Peeters, A., Vos, T., Sicree, R., Shaw, J., Sindall, C., Zimmet, P. Z. (2009). Projecting the burden of diabetes in Australia – what is the size of the matter? Australian and New Zealand Journal of Public Health, 33(6), 540-543.
- Johnson, K. A., Meyer, J., Yazar, S., & Turner, A. W. (2015). Real-time teleophthalmology in rural Western Australia. Australian Journal of Rural Health, 23(3), 142–149.
- O’Halloran, R. A., & Turner, A. W. (2017). Evaluating the impact of optical coherence tomography in diabetic retinopathy screening for an Aboriginal population. Clinical & Experimental Ophthalmology, Accepted Articles(http://dx.doi.org/10.1111/ceo.13018), 1-19.
- Brazionis, L., Jenkins, A., Keech, A., Ryan, C., Brown, A., Boffa, J., & Bursell, S. (2018). Diabetic retinopathy in a remote Indigenous primary healthcare population: a Central Australian diabetic retinopathy screening study in the Telehealth Eye and Associated Medical Services Network project. Diabetic Medicine, Accepted Articles(http://dx.doi.org/10.1111/dme.13596).
- Pires, R., Carvalho, T., Spurling, G., Goldenstein, S., Wainer, J., Luckie, A., Rocha, A. (2015). Automated multi-lesion detection for referable diabetic retinopathy in Indigenous health care. PLOS ONE, 10(6). Retrieved from: http://dx.doi.org/10.1371/journal.pone.0127664
- Gargeya, R., & Leng, T. (2017). Automated identification of diabetic retinopathy using deep learning. Ophthalmology, 124(7), 962-969.
- Jung, J., Rahman, S., Rashid, H., & Khandaker, G. (2014). Current status of trachoma elimination in Australia: making trachoma a history by 2020. Infectious Disorders – Drug Targets, 14(3), 219-222.
- HealthConsult. (2010). Review of current arrangements for the collection, recording, transfer and reporting of national trachoma data. Canberra: Office of Aboriginal and Torres Strait Islander Health, Department of Health and Ageing.
- Taylor, H. R., & Anjou, M. D. (2013). Trachoma in Australia: an update. Clinical & Experimental Ophthalmology, 41(5), 508–512.
- The Kirby Institute. (2015). Australian trachoma surveillance report 2014. Sydney: The Kirby Institute, University of New South Wales.
- The Kirby Institute. (2011). Australian trachoma surveillance report 2010. Sydney: The Kirby Institute, University of New South Wales.
- Australian Institute of Health and Welfare. (2005). Vision problems among older Australians. Canberra: Australian Institute of Health and Welfare.
- Warren, J. M., & Birrell, A. L. (2016). Trachoma in remote Indigenous Australia: a review and public health perspective. Australian and New Zealand Journal of Public Health, 40(S1), S48–S52.
- Mak, D. B., O’Neill, L. M., Herceg, A., & McFarlane, H. (2006). Prevalence and control of trachoma in Australia, 1997-2004. Communicable Diseases Intelligence, 30(2), 236-247.
- The Kirby Institute. (2016). 2015 Australian trachoma surveillance preliminary report. Sydney: The Kirby Institute, University of New South Wales.
- World Health Organization. (2012). Trachoma simplified grading card. Geneva: World Health Organization.
- Gambhir, M., Basáñez, M., Burton, M. J., Solomon, A. W., Bailey, R. L., Holland, M. J., Grassly, N. C. (2009). The development of an age-structured model for trachoma transmission dynamics, pathogenesis and control. PLOS Neglected Tropical Diseases, 3(6). Retrieved from: https://doi.org/10.1371/journal.pntd.0000462
- Hansen-Knarhoi, M. (2011). Towards GET 2020: trachoma in the Northern Territory 2010. Northern Territory Disease Control Bulletin, 18(3), 24-32.
- Steering Committee for the Review of Government Service Provision. (2011). Overcoming Indigenous disadvantage: key indicators 2011. Canberra: Productivity Commission, Australia.
- Shattock, A. J., Gambhir, M., Taylor, H. R., Cowling, C. S., Kaldor, J. M., & Wilson, D. P. (2015). Control of trachoma in Australia: a model based evaluation of current interventions. PLOS Neglected Tropical Diseases, 9(4). Retrieved from: http://dx.doi.org/10.1371/journal.pntd.0003474
- The Kirby Institute. (2017). Australian trachoma surveillance report 2016. Sydney: The Kirby Institute, University of New South Wales.
- Communicable Disease Network Australia. (2006). Guidelines for the public health management of trachoma in Australia. Canberra: Department of Health and Ageing.
- Tellis, B., Keeffe, J. E., & Taylor, H. R. (2007). Surveillance report for active trachoma, 2006: National Trachoma Surveillance and Reporting Unit. Communicable Diseases Intelligence, 31(4), 366-374.
- Taylor, H. R., Fox, S. S., Xie, J., Dunn, R. A., Arnold, A.-L. M. R., & Keeffe, J. E. (2010). The prevalence of trachoma in Australia: the National Indigenous Eye Health Survey. Medical Journal of Australia, 192(5), 248-253.
- Cowling, C. S., Liu, B. C., Snelling, T. L., Ward, J. S., Kaldor, J. M., & Wilson, D. P. (2016). Australian trachoma surveillance annual report, 2013. Communicable Diseases Intelligence, 40(2), E255-E266.
- Dirani, M., Keel, S., Foreman, J., van Wijngaarden, P., & Taylor, H. R. (2017). Prevalence of trachomatous trichiasis in Australia: the National Eye Health Survey. Clinical & Experimental Ophthalmology, Accepted Articles(http://dx.doi.org/10.1111/ceo.13003), 1-13.
- Williams, P., Oosterhuis, C., & O’Neill, M. (2013). A trichiasis screening program in the Kimberley 2008–2010. Australian and New Zealand Journal of Public Health, 37(3), 290.
- Landers, J., Henderson, T., & Craig, J. (2010). Prevalence and associations of blinding trachoma in Indigenous Australians within Central Australia: the Central Australian Ocular Health Study. Clinical & Experimental Ophthalmology, 38(4), 389-404.
- Landers, J., Kleinschmidt, A., Wu, J., Burt, B., Ewald, D., & Henderson, T. (2005). Prevalence of cicatricial trachoma in an Indigenous population of Central Australia: the Central Australian Trachomatous Trichiasis Study (CATTS). Clinical & Experimental Ophthalmology, 33(2), 142-146.
- Atik, A. (2010). Trachoma in Australia – eye to eye with reality. Aboriginal and Islander Health Worker Journal, 34(5), 20-22.
- Lansingh, V. C., Mukesh, B. N., Keeffe, J. E., & Taylor, H. R. (2010). Trachoma control in two Central Australian Aboriginal communities: a case study. International Ophthalmology, 30(4), 367-375.
- Wright, H. R., Keeffe, J. E., & Taylor, H. R. (2010). Barriers to the implementation of the SAFE strategy to combat hyperendemic trachoma in Australia. Ophthalmic Epidemiology, 17(6), 349-359.
- Kuper, H., Solomon, A. W., Buchan, J., Zondervan, M., Foster, A., & Mabey, D. (2003). A critical review of the SAFE strategy for the prevention of blinding trachoma. Lancet Infectious Diseases, 3(6), 372-381.
- Ejere, H. O. D., Alhassan, M. B., & Rabiu, M. (2012). Face washing promotion for preventing active trachoma. Cochrane Database of Systematic Reviews, (4). Retrieved from: http://dx.doi.org/10.1002/14651858.CD003659.pub3
- Lange, F. D., Baunach, E., McKenzie, R., & Taylor, H. R. (2014). Trachoma elimination in remote Indigenous Northern Territory communities: baseline health-promotion study. Australian Journal of Primary Health, 20(1), 34-40.
- Atkinson, J. R., Boudville, A. I., Stanford, E. E., Lange, F. D., & Anjou, M. D. (2014). Australian Football League clinics promoting health, hygiene and trachoma elimination: the Northern Territory experience. Australian Journal of Primary Health, 20(4), 334-338.
- Lange, F. D., Jones, K., Ritte, R., Brown, H. E., & Taylor, H. R. (2017). The impact of health promotion on trachoma knowledge, attitudes and practice (KAP) of staff in three work settings in remote Indigenous communities in the Northern Territory. PLOS Neglected Tropical Diseases, 11(5). Retrieved from: https://doi.org/10.1371/journal.pntd.0005503
- Baunach, E., Lines, D., Pedwel, B., Lange, F., Cooney, R., & Taylor, H. R. (2012). The development of culturally safe and relevant health promotion resources for effective trachoma elimination in remote Aboriginal communities. Aboriginal and Islander Health Worker Journal, 36(2), 9-11,16,19.
- Indigenous Eye Health. (2018). About trachoma. Retrieved 2018 from https://mspgh.unimelb.edu.au/centres-institutes/centre-for-health-equity/research-group/ieh#trachoma
- The Kirby Institute. (2016). Australian trachoma surveillance report 2015. Sydney: The Kirby Institute, University of New South Wales.
- Department of Health and Ageing. (2011). Eye health schemes (aids and appliances). from http://www.health.gov.au/internet/main/publishing.nsf/Content/optometry_eye_health#eyesubsidy
- Optometry Australia. (2016). Principles for nationally consistent subsidised spectacle schemes for Aboriginal and Torres Strait Islander people – recommended implementation standards. Melbourne: Vision 2020.
- Australian College of Optometry. (2012). Outreach services. Retrieved 13 February 2012 from http://aco.org.au/eye-care-services/eye-care-in-melbourne/services-offered/outreach-services
- Department of Health and Ageing. (2008). National framework for action to promote eye health and prevent avoidable blindness and vision loss: progress report to Australian Health Ministers’ Conference. Canberra: Department of Health and Ageing, Australia.
- Vision Initiative. (2015). Vision Initiative end of program evaluation report 2012-15. Melbourne: Vision 2020 Australia.
- Jones, J. N., Henderson, G., Poroch, N., Anderson, I., & Taylor, H. (2011). A critical history of Indigenous eye health policy-making : towards effective system reform. Melbourne: Indigenous Eye Health Unit, the University of Melbourne.
- Vision 2020 Australia. (2010). Eliminating avoidable blindness and reducing the impact of vision loss in Australia by 2020 : policy proposal. Melbourne: Vision 2020 Australia.
- Commonwealth of Australia. (2005). National framework for action to promote eye health and prevent avoidable blindness and vision loss. Canberra: Commonwealth of Australia.
- Taylor, H. R., Keeffe, J. E., Vu, H. T. V., Wang, J. J., Rochtchina, E., Mitchell, P., & Pezzullo, M. L. (2005). Vision loss in Australia. Medical Journal of Australia, 182(11), 565-568.
- Access Economics. (2004). Clear Insight: The economic impact and cost of vision loss in Australia: Access Economics Pty Limited.
- Access Economics. (2005). Investing in sight: strategic interventions to prevent vision loss in Australia. Melbourne: Eye Research Australia.
- Vision 2020 Australia. (2010). Improving outcomes for Aboriginal and Torres Strait Islander eye health and vision care. Melbourne: Vision 2020 Australia.
- Vision 2020 Australia. (2013). Progressing Aboriginal and Torres Strait Islander eye health and vision care: policy and funding proposal, 2013. Melbourne: Vision 2020 Australia.
- Vision 2020 Australia. (2015). Close the gap in Aboriginal and Torres Strait Islander Eye health and vision care: sector funding proposal. Melbourne: Vision 2020 Australia.
- Vision 2020 Australia. (2017). Closing the Gap in eye health and vision care by 2020. Melbourne: Vision 2020 Australia.
- Vision 2020 Australia. (2018). Vision 2020 Australia submission to the Closing the Gap Refresh: discussion paper. Melbourne: Vision 2020 Australia.
- Office for Aboriginal and Torres Strait Islander Health. (2011). Improving eye and ear health services for Indigenous Australians for better education and employment outcomes. Retrieved 2011
- Department of Health and Ageing. (2011). Program guidelines for the Visiting Optometrists Scheme: incorporating the core visiting Optometrists scheme element and the visiting Optometrists scheme expansion for Indigenous Australians element. Canberra: Department of Health and Ageing, Australia.
- PricewaterhouseCoopers Australia. (2015). The value of Indigenous sight: an economic analysis. Melbourne: Indigenous Eye Health.
- Taylor, H. R., & Stanford, E. E. (2011). Coordination is the key to the efficient delivery of eye care services in Indigenous communities. Clinical & Experimental Ophthalmology, 39(2), 186–188.
- Boudville, A. I., Anjou, M. D., & Taylor, H. R. (2013). Improving eye care for Indigenous Australians in primary health care settings. Australian Journal of Rural Health, 21(2), 121-127.
- Taylor, H. R., & Stanford, E. (2010). Provision of Indigenous eye health services. Melbourne: Indigenous Eye Health Unit, Melbourne School of Population Health.
- Indigenous Eye Health. (2017). 2017 annual update on the implementation of the Roadmap to Close the Gap for Vision. Melbourne: Indigenous Eye Health, the University of Melbourne.
- Indigenous Eye Health. (2018). 2018 annual update on the implementation of the Roadmap to Close the Gap for Vision. Melbourne: Indigenous Eye Health.
- Tan, I. J., Dobson, L. P., Bartnik, S., Muir, J., & Turner, A. W. (2017). Real-time teleophthalmology versus face-to-face consultation: a systematic review. Journal of Telemedicine and Telecare, 23(7), 629-638.
- Bartnik, S. E., Copeland, S. P., Aicken, A. J., & Turner, A. W. (2018). Optometry-facilitated teleophthalmology: an audit of the first year in Western Australia. Clinical and Experimental Optometry, Early view(https://doi.org/10.1111/cxo.12658).
- Host, B. K., Turner, A. W., & Muir, J. (2018). Real-time teleophthalmology video consultation: an analysis of patient satisfaction in rural Western Australia. Clinical and Experimental Optometry, 101(1), 129-134.
- Xiao, D., Vignarajan, J., Boyle, J., Zhang, M., Estai, M. R., Tennant, M., Kanagasingam, Y. (2015). Development and practice of store-and-forward telehealth systems in ophthalmology dental and emergency. In A. Georgiou, H. Grain & L. K. Schaper (Eds.), Driving reform: digital health is everyone’s business (pp. 167-173). Amsterdam: IOS Press.
- Ting, D. S. W., Tay-Kearney, M. L., Constable, I., Vignarajan, J., & Kanagasingam, Y. (2013). Retinal video recordings at different compression levels: a novel video-based imaging technology for diabetic retinopathy screening. Eye, 27, 848-853.
- Ting, D. S., Tay-Kearney, M. L., Vignarajan, J., & Kanagasingam, Y. (2012). Diabetic retinopathy screening: can the viewing monitor influence the reading and grading outcomes. Eye, 26, 1511-1516.
- Brazionis, L., Jenkins, A., Keech, A., Ryan, C., & Bursell, S. (2017). An evaluation of the telehealth facilitation of diabetes and cardiovascular care in remote Australian Indigenous communities: – protocol for the telehealth eye and associated medical services network [TEAMSnet] project, a pre-post study design. BMC Health Services Research, 17(1). Retrieved from: http://dx.doi.org/10.1186/s12913-016-1967-4
- Bastawrous, A., Mathenge, W., Peto, T., Weiss, H. A., Rono, H., Foster, A., Kuper, H. (2014). The Nakuru eye disease cohort study: methodology & rationale. BMC Ophthalmology, 14. Retrieved from: https://doi.org/10.1186/1471-2415-14-60
- Bastawrous, A., Rono, H. K., Livingstone, I. A., Weiss, H. A., Jordan, S., Kuper, H., & Burton, M. J. (2015). Development and validation of a smartphone-based visual acuity test (peek acuity) for clinical practice and community-based fieldwork. JAMA Ophthalmology, 133(8), 930-937.
- Lodhia, V., Karanja, S., Lees, S., & Bastawrous, A. (2016). Acceptability, usability, and views on deployment of Peek, a mobile phone mHealth intervention for eye care in Kenya: qualitative study. JMIR mHealth and uHealth, 4(2). Retrieved from: https://doi.org/10.2196/mhealth.4746
- Bastawrous, A., Giardini, M. E., Bolster, N. M., Peto, T., Shah, N., Livingstone, I. A., Burton, M. (2016). Clinical validation of a smartphone-based adapter for optic disc imaging in Kenya. JAMA Ophthalmology, 134(2), 151-158.
- Keel, S., Lee, P. Y., Scheetz, J., Li, Z., Kotowicz, M. A., MacIsaac, R. J., & He, M. (2018). Feasibility and patient acceptability of a novel artificial intelligence-based screening model for diabetic retinopathy at endocrinology outpatient services: a pilot study. Scientific Reports, 8. Retrieved from: https://doi.org/10.1038/s41598-018-22612-2
- Rajalakshmi, R., Subashini, R., Anjana, R. M., & Mohan, V. (2018). Automated diabetic retinopathy detection in smartphone-based fundus photography using artificial intelligence. Eye. Retrieved from: https://doi.org/10.1038/s41433-018-0064-9
- Gulshan, V., Peng, L., Coram, M., Stumpe, M. C., Wu, D., Narayanaswamy, A., Webster, D. R. (2016). Development and validation of a deep learning algorithm for detection of diabetic retinopathy in retinal fundus photographs. JAMA, 316(22), 2402-2410.
Footnotes
[1] There are problems associated with self-reported data including the under-reporting of undiagnosed conditions [19]
[2] Incidence in this study was calculated as an annual percentage (per year) over three years.
[3] Eye and sight problems include: cataract; glaucoma; disorders of the choroid and retina; disorders of the ocular muscles, binocular movement, accommodation and refraction; visual disturbances and blindness; and other diseases of the eye and adnexa [72].
[4] The differences between the proportions for Aboriginal and Torres Strait Islander people and those for non-Indigenous people are statistically significant [74].
[5] The differences between the proportions for Aboriginal and Torres Strait Islander people and those for non-Indigenous people are not statistically significant [74].
[6] Non-remote areas include major cities and inner and outer regional areas [75].
[7] Other diseases of the eye and adnexa include: glaucoma, macular degeneration, astigmatism and presbyopia [73].
[8] The ABS warns that this proportion has a relative standard error greater than 50% and is considered too unreliable for general use [9].
[9] http://www.vision2020australia.org.au/news/2018-07-13/peak-health-groups-welcome-government-funding-for-new-national-diabetes-eye-screening-program-to-prevent-blindness
[10] http://www.vision2020australia.org.au/news/2018-08-01/good-news-continues-for-indigenous-eye-health-with-program-extension
[11] https://www.brienholdenvision.org/provision-of-eye-health-equipment-and-training.html
[12] http://www.health.gov.au/internet/main/publishing.nsf/Content/budget2011-flexfund-rural13.htm
[13] The terms ‘telehealth’, ‘telemedicine’ and ‘teleophthalmology’ are used interchangeably by authors and practitioners.